
|
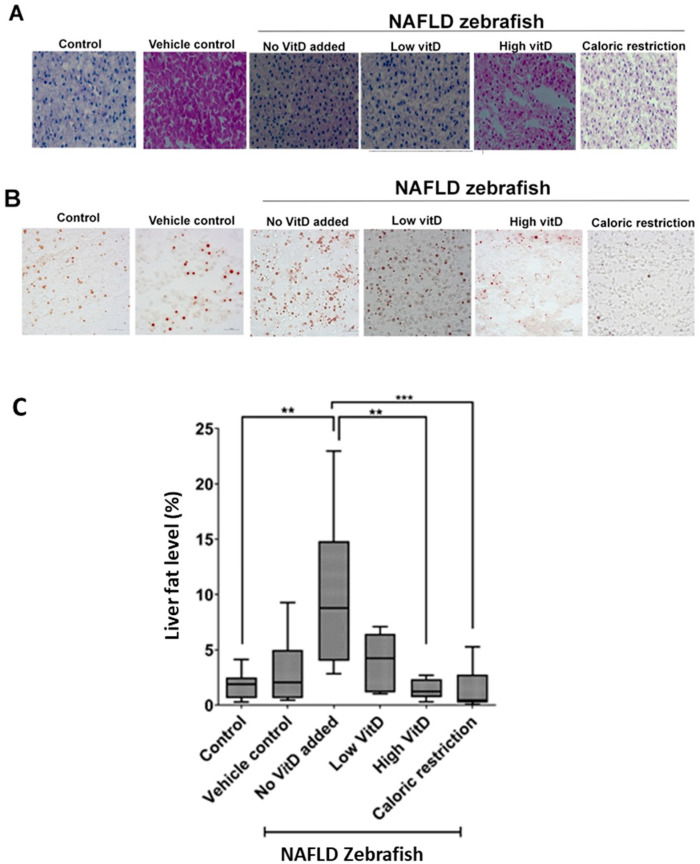
Figure 2
Liver morphology and fat level in NAFLD zebrafish supplemented with VitD. Histology staining of liver sections was performed in the following groups: control (normal feeding; 2 meal/day/3L tank), vehicle control (2 meal/day/3L tank with ethanol addition), no VitD added (3 meal/day/3L tank), low VitD (3 meal/day/3L tank with 0.049 µg VitD per meal), high VitD (3 meal/day/3L tank with 1.25 µg VitD per meal), caloric restriction (1 meal/day/3L tank). (A) Liver morphology by hematoxylin and eosin staining. (B) Representative images of lipid content in the liver measured by ORO staining. Magnification ×40, scale bar 20 µm. (C) For each group, images of ORO-stained area were used to calculate the fat level in the liver. ** p < 0.05, *** p< 0.001.