
|
Fig. 7
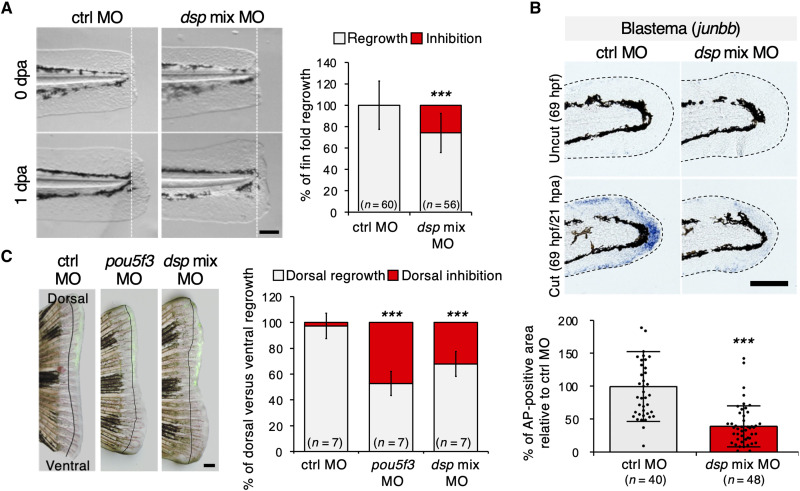
(A) Phase-contrast images of larvae fin folds after amputation. Fin fold amputation was done at 2 dpf and photographed 24 hours later. The graph shows the percentage of 1-dpa versus 0-dpa fin fold outgrowth (in gray) and average inhibition of 1-dpa versus 0-dpa fin fold (in red). Scale bar, 100 μm (n = 60, 56 embryos, P < 0.0001). dpa, days postamputation; ctrl, control; MO, morpholino; dsp mix MO, dspa MO + dspb MO. (B) Whole-mount in situ hybridization (WISH) analysis of larvae fin folds with control MO or dsp mix MO. Representative phase-contrast images and quantitative analysis show the expression of blastema marker gene (junbb) in regenerating fin folds. Uncut controls were equivalently stained. Dotted lines indicate the boundary of the fin folds. Scale bar, 100 μm (n = 40, 48 embryos, P < 0.0001). hdf, hours postfertilization; hpa, hours postamputation. (C) Phase-contrast and fluorescence merged images of adult fins after injection and electroporation with ctrl MO, pou5f3 MO (positive control), and dsp mix MO. Injection was done into the dorsal half of a 2-dpa blastema and photographed 24 hours later. The graph shows the percentage of dorsal versus ventral fin outgrowth (in gray) and average inhibition of dorsal versus ventral fin (in red). The line on each image denotes the fins at 2 dpa. Scale bar, 500 μm (n = 7 fishes, P < 0.0001). Error bars represent ± SD. P values <0.05 were considered significant (***P < 0.001), and two-tailed, paired Student’s t test was used. Data are representative of two independent experiments. See Materials and Methods for exact calculation.