
|
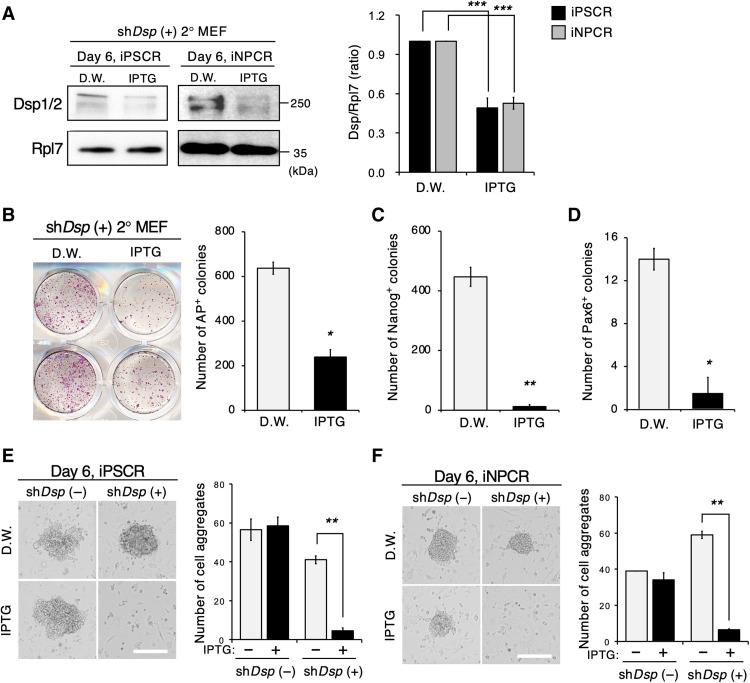
Fig. 3
(A) Western blot for Dsp and Rpl7 during iPSCR and PDR of shDsp–green fluorescent protein (GFP)–positive sorted 2° MEFs. The bar graph indicates the quantitative expression of Dsp. Samples were harvested at day 6 in both iPSCR and iNPC. Four independent experiments were performed and Rpl7 was used as the loading control (n = 2 wells, P < 0.0001). D.W., distilled water; IPTG, isopropyl β-d-1-thiogalactopyranoside. (B and C) Whole-well imaging of alkaline phosphatase (AP) staining and quantitative analysis of the AP+ colonies (B) and Nanog+ colonies (C) at day 12 of iPSCR with D.W. or IPTG (B, n = 2 wells, P = 0.0112; C, n = 2 wells, P = 0.0056). (D) Quantitative analysis of Pax6+ colonies at day 12 of iNPCR with D.W. or IPTG (n = 2 wells; P = 0.0202). (E and F) Representative phase-contrast images and quantitative analysis of cell aggregates on day 6 of iPSCR (E) and iNPCR (F) with D.W. or IPTG. Scale bars, 200 μm [E, n = 2 wells; shDsp (−), P = 0.80; shDsp (+), P = 0.0047] [F, n = 2 wells; shDsp (−), P = 0.34; shDsp (+), P = 0.0015]. Error bars represent ± SEM (A) or ± SD (B to F). P values <0.05 were considered significant (*P < 0.05 and **P < 0.01), two-tailed, paired Student’s t test was used. Data are representative of two independent experiments.