
|
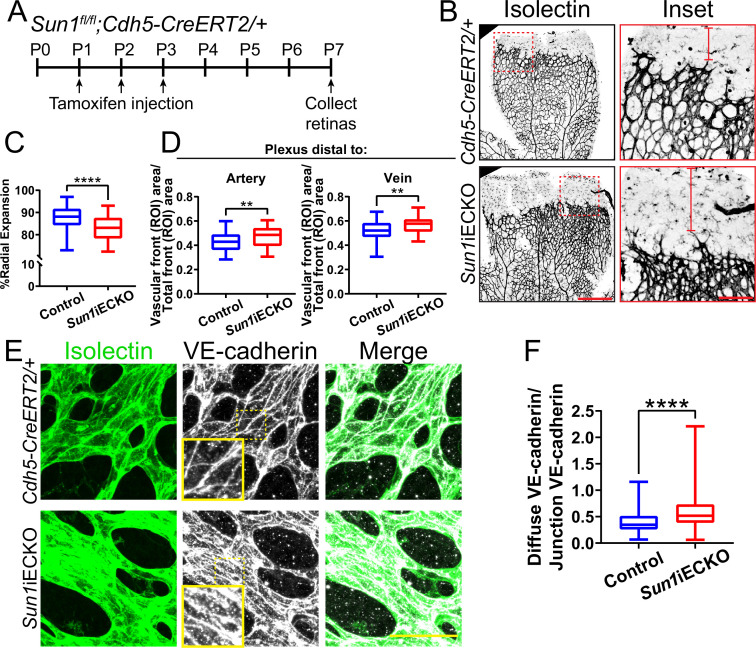
Figure 1
(A) Schematic of tamoxifen-induced excision of exon 4 of Sun1 in pups from cross of Sun1fl/fl × Sun1fl/+;Cdh5-CreERT2 mice. (B) Representative images of postnatal day (P)7 mouse retinas of indicated genotypes, stained for IB4 (isolectin). Scale bar, 500 µm. Inset shows vascular plexus ahead of vein. Red line shows expansion of vascular front. Scale bar inset, 150 µm. (C) Quantification of vessel network radial expansion in (B). n=186 ROIs from 44 retinas (controls) and 63 ROIs from 16 retinas (Sun1iECKO) from six independent litters. ****, p<0.0001 by Student’s two-tailed unpaired t-test. (D) Quantification of vascular density ahead of either arteries or veins. n=87 ROIs (controls, artery), 38 ROIs (Sun1iECKO, artery), 84 ROIs (controls, vein), and 37 ROIs (Sun1iECKO, vein) from 27 retinas (controls) and 12 retinas (Sun1iECKO) from three independent litters. **, p<0.01 by Student’s two-tailed unpaired t-test. (E) Representative images of IB4 (isolectin) (green, vessels) and VE-cadherin (white, junctions) staining in P7 retinas of indicated genotypes. Scale bar, 50 µm. (F) Quantification of disorganized VE-cadherin as shown in (E). n=160 junctions (10 retinas, controls) and 160 junctions (10 retinas, Sun1iECKO). ****, p<0.0001 by Student’s two-tailed unpaired t-test. For all graphs, boxes represent the upper quartile, lower quartile, and median; whiskers represent the minimum and maximum values.
The nuclear LINC protein SUN1 regulates vascular development.