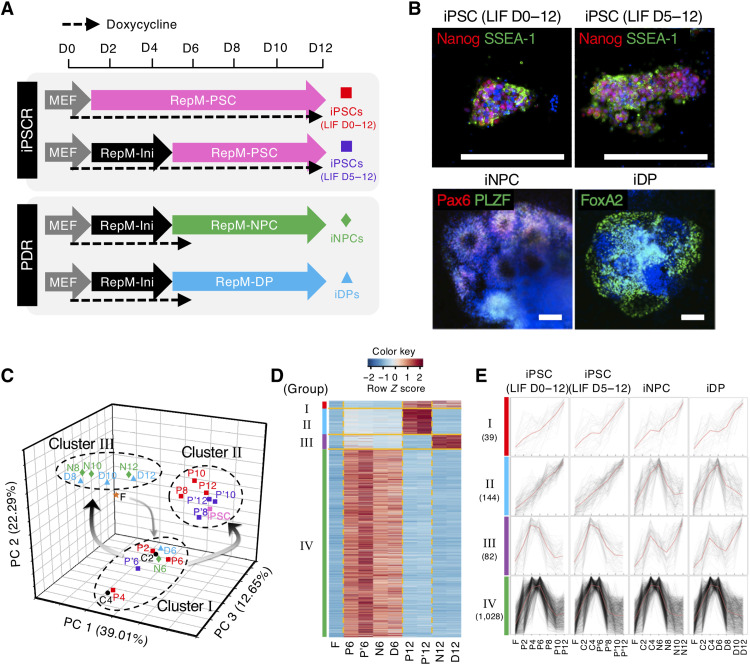
Fig. 1
(A) Schematic of the four reprogramming regimes from 2° MEFs to iPSCs using two different protocols (top), or via PDR to iNPCs or iDPs (bottom). D, day; MEF, medium for mouse embryonic fibroblast (MEF); RepM-Ini, reprogramming initiation medium; RepM-PSC, reprogramming medium for pluripotent stem cell (PSC); RepM-NPC, reprogramming medium for neural stem/progenitor cell (NPC); RepM-DP, reprogramming medium for dopaminergic neuronal progenitor (DP). (B) Immunostaining images of cells from the four reprogramming regimes as in (A) on day 12 with markers for iPSC (Nanog and SSEA-1), iNPC (Pax6 and PLZF), or iDP (FoxA2). Scale bars, 200 μm. (C) Principal components analyses (PCA) of the microarray datasets. Each reprogramming sample is colored by the reprogramming regime. The numbers indicate the days after reprogramming when RNA was collected. F, 2° MEFs; C, common intermediates without LIF; P, iPSC reprogramming (LIF D0 to D12); P′, iPSCR (LIF D5 to D12); N, iNPC reprogramming; D, iDP reprogramming. (D) Heatmap showing gene expression of four groups in 2° MEFs (F), at day 6 samples (P6, P′6, N6, and D6), and day 12 samples (P12, P′12, N12, and D12). (E) The individual expression patterns of the four groups are superimposed. The number of genes in each group is presented. All values were normalized to the average expression of each gene and visualized by a line plot. Red line represents mean of gene expression.

