
|
Fig. 4
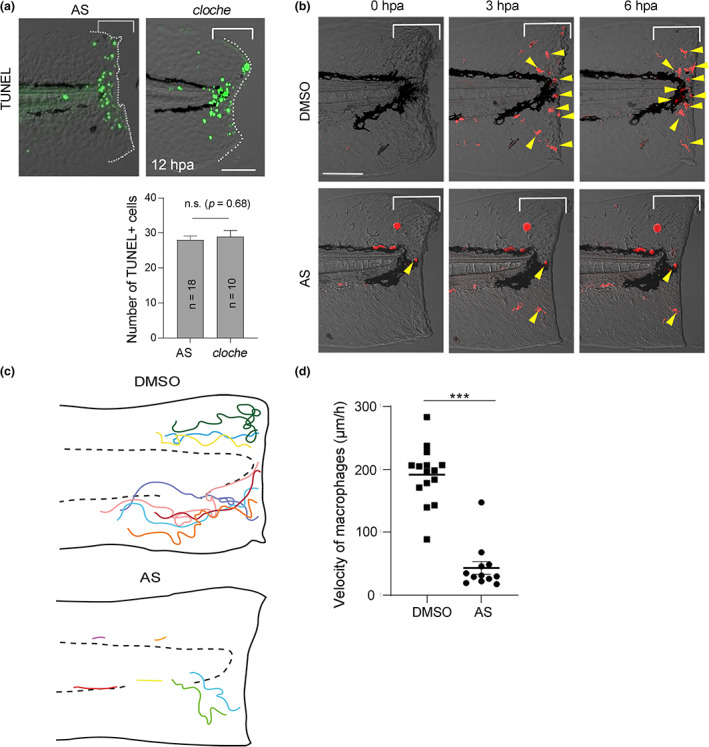
Loss of macrophage recruitment caused by PI3Kγ knockdown. (a) Comparison of regeneration‐dependent apoptosis of AS‐treated larva and cloche (clo) mutant. Terminal deoxynucleotidyl transferase dUTP nick end labeling (TUNEL) stained AS‐treated larva and clo mutant was compared side‐by‐side at 12 hpa. Scale bar, 50 μm. (b) Macrophage migration and accumulation at the injured site visualized by Tg(mpeg1:mCherry). The time‐lapse recording was done at 0–6 hpa with a confocal microscope using a water immersion objective lens, and the images were taken from the recorded live images. Yellow arrowheads indicate mpeg1 + macrophages. Scale bar, 50 μm. (c) Schematic diagrams showing a 6 h time‐lapse of the injured fin fold and migration trajectory of macrophages arriving at the wound in dimethyl sulfoxide (DMSO)‐ and AS‐treated larvae during the recruitment phase. Respective colored lines indicate the trajectories of individual macrophages. (d) Macrophage velocity quantification in DMSO‐ and AS‐treated larvae. Data are presented as the mean ± SEM and analyzed by Student's t‐test; ***p < 0.001. For further information, please refer to Videos S1 and S2