
|
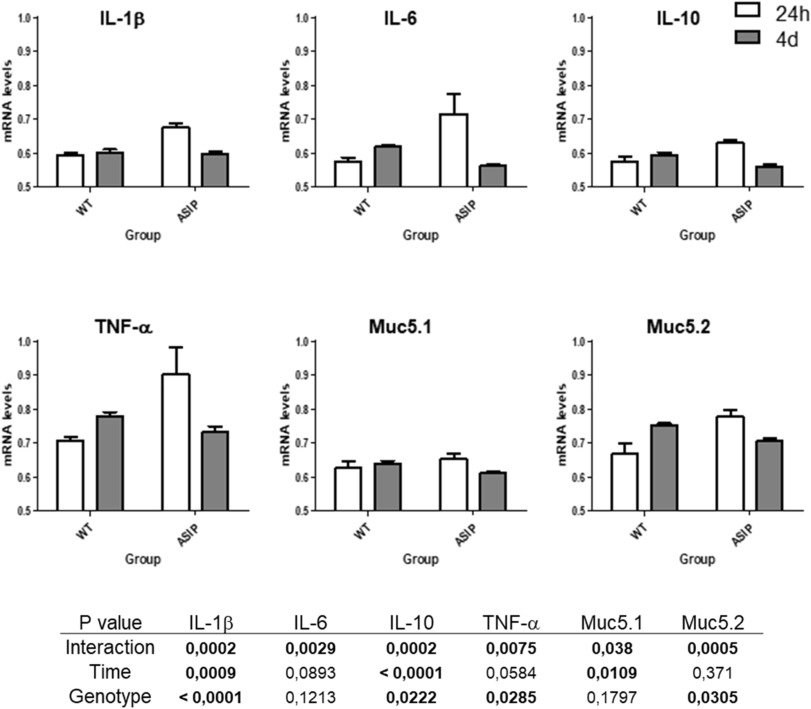
Fig. 10 Fig. 10. Transcriptional levels of cytokines and mucins following exposure to LPS. In a subsequent experiment to that shown in Fig. 9, zebrafish (WT and ASIP1) were exposed to a challenge bath with 100 μg/ml of LPS during 4 h. Animals were then transferred to fresh water and skin samples (n = 10) were taken after 1 and four days, t for RNA extraction to determine the levels of expression of some pro-inflammatory cytokines and two mucins by real-time PCR. Data are shown as mean gene expression relative to endogenous control β-actin expression mean ± SEM (n = 10). Data were analyzed with a two-way ANOVA test. The differences were considered significant when p < 0.05.