
|
Figure 2
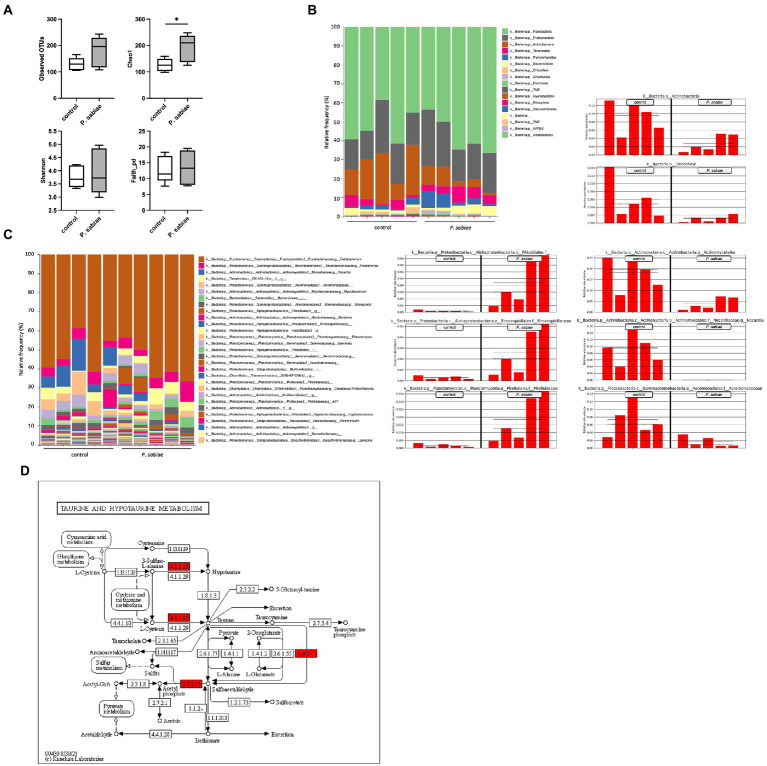
The gut microbiome analysis of the P. sabiae-exposed zebrafish. (A) The diversity indices, Observed OTUs, Chao1, and Shannon, Faith_pd in the P. sabiae-exposed and the control zebrafish gut microbiomes. All OTUs detected by the microbiome analysis are summarized in Supplementary Table S2. (B) The phylum level and (C) genus level analyses of the zebrafish gut microbiome were conducted. The representative OTUs which increased and decreased in the P. sabiae-exposed zebrafish gut microbiomes are extracted by the LEfSe analysis. All OTUs extracted by the LEfSe analysis are summarized in Supplementary Table S3. (D) The PICRUSt2 functional analysis with METACYC database revealed that the functions of superpathway of taurine degradation (PWY-1541) was significantly reduced in the P. sabiae-exposed zebrafish gut microbiome (Supplementary Table S7). The predicted taurine metabolism pathways are represented with KEGG Mapper. Reduced functions in the taurine metabolic pathway in the P. sabiae-exposed zebrafish gut microbiome are shown as red. N = 5, *p < 0.05.