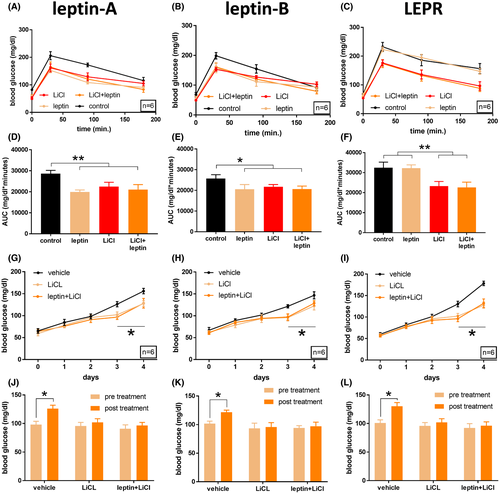
Fig. 4 Activation of canonical Wnt signaling improves glucose tolerance in lepanz301 fish, lepbnz302 fish, and leprnz303 zebrafish. (A) Glucose tolerance of adult male lepanz301 zebrafish (n = 6). Fish were treated 10 μM LiCl (3 h before glucose injection), 0.6 g/L of recombinant mouse leptin dissolved in Cortland salt solution (1 h before glucose injection), vehicle only, or a combination of LiCl and leptin. Following 0.5 mg/g glucose injection, blood samples were taken at 30, 90, and 180 min post-injection. (B) Same as (A), but for lepbnz302 fish. (C) Same as (A) and (B), but for leprnz303 fish. (D) Area under the curve of (A). **p < .001, one-way ANOVA. (E) Area under the curve of (B). *p < .05, one-way ANOVA. (F) Area under the curve of (C). **p < .001, one-way ANOVA. (G) Blood glucose values of adult male lepanz301 zebrafish (n = 6) over the course of a 4-day immersion in a 1% glucose solution. On the third day, fish were exposed to 10 μM LiCl for three h before daily blood sampling. One hour before blood sampling, fish were injected intraperitoneally with 0.6 g/L of recombinant mouse leptin dissolved in Cortland salt solution, or with vehicle only. *p < .05, repeated-measures ANOVA. (H) Same as (G), but for lepbnz302 fish. *p < .05, repeated-measures ANOVA. (I) Same as (G) and (H), but for leprnz303 fish. *p < .05, repeated-measures ANOVA. (J) Blood glucose levels of (G), comparing pre-treatment (day 2) and post-treament (day 3). (K) Same as (J) but relating to (H). (L) Same as (J) and (K) but relating to (I)
Image
Figure Caption
Figure Data
Acknowledgments
This image is the copyrighted work of the attributed author or publisher, and
ZFIN has permission only to display this image to its users.
Additional permissions should be obtained from the applicable author or publisher of the image.
Full text @ FASEB J.

