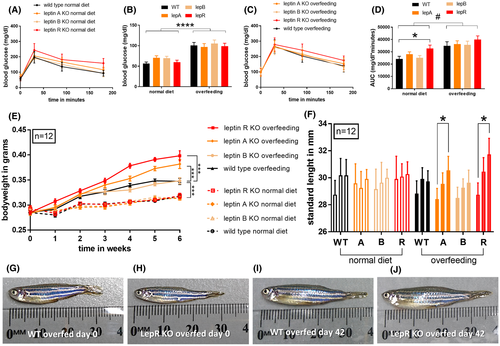
Fig. 2 Regulation of glucose homeostasis and body weight in adult zebrafish. (A) Glucose tolerance in normal-fed lepanz301 fish, lepbnz302 fish, leprnz303 fish, and wild-type controls (n = 12). (B) Baseline blood glucose levels of normal-fed and overfed lepanz301 fish, lepbnz302 fish, leprnz303 fish, and wild-type controls. ****p < .0001, two-way ANOVA. (C) Glucose tolerance in overfed lepanz301 fish, lepbnz302 fish, leprnz303 fish, and wild-type controls (n = 12). (D) Area under the curve of (A) and (C). *p < .05, one-way ANOVA; #p < .05, two-way ANOVA. (E) Body weights of lepanz301 fish, lepbnz302 fish, leprnz303 fish, and wild-type control on a 6-week normal diet or overfeeding regime. ***p < .001, repeated-measures ANOVA. (F) Standard length of normal-fed and overfed lepanz301 fish, lepbnz302 fish, leprnz303 fish, and wild-type controls at 0, 3, and 6 weeks. *p < .05, one-way ANOVA. (G–J) Examples of leptin receptor-deficient and wild-type zebrafish at the start and end of the overfeeding regime
Image
Figure Caption
Figure Data
Acknowledgments
This image is the copyrighted work of the attributed author or publisher, and
ZFIN has permission only to display this image to its users.
Additional permissions should be obtained from the applicable author or publisher of the image.
Full text @ FASEB J.

