
|
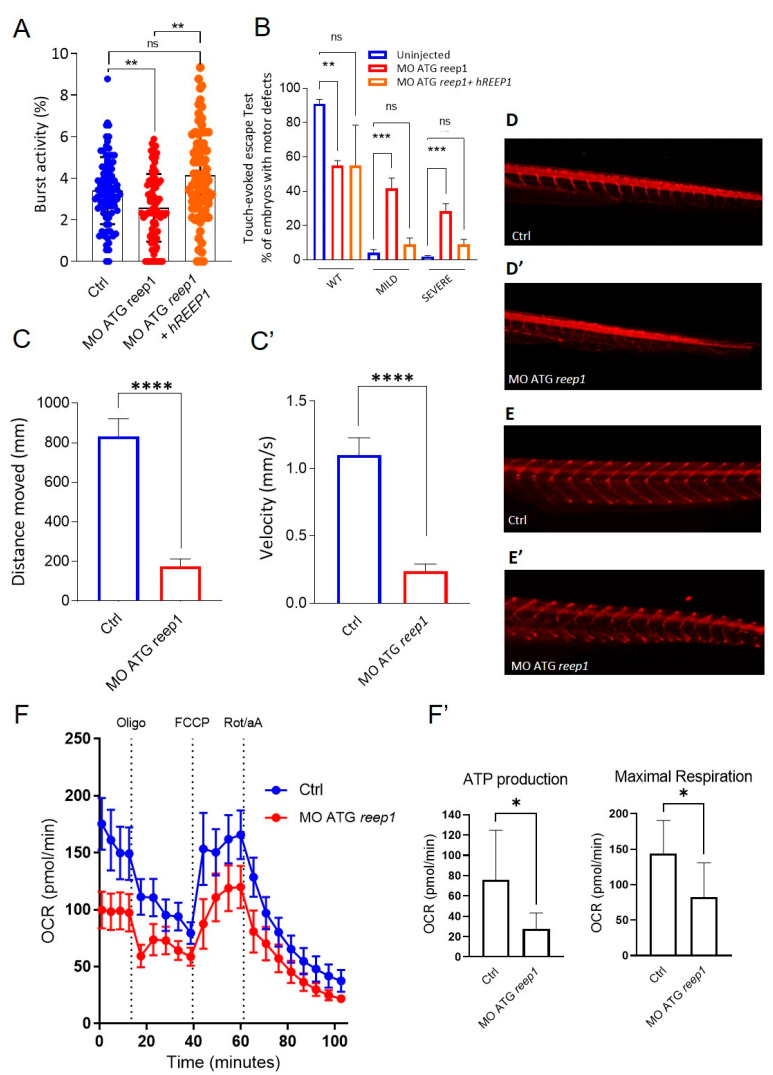
Figure 5
Phenotype characterization of the reep1 zebrafish model. (A) Coiling frequency in zebrafish embryos at 30 hpf is decreased in reep1 morphant compared with WT (MO ATG reep1 n = 90; controls n = 90; MO ATG reep1 + hREEP1 n = 90, in 3 independent experiments). The co-injection of embryos at one-cell stage with human mRNA/REEP1 and reep1 MO ATG was able to rescue the locomotor impairment. (B) Touched evoked response analysis, showing decreased movement in response to touch stimulus of morphants at 48 hpf compared to uninjected controls. The co-injection of embryos at 48 hpf with human mRNA/REEP1 and reep1 MO ATG was able to rescue the touched evoked phenotype. Statistics were calculated by a two-tailed unpaired t-test. (C,C’). Automated analysis of spontaneous motor activity revealed a reduction in swim distance and velocity in reep1 morphant larvae at 120 hpf compared to control siblings (MO ATG reep1 n = 120; controls n = 120, in 3 independent experiments). (D,D’). Lateral tail views at 48 hpf of whole-mount larvae labeled with anti-acetylated alfa-tubulin (MO ATG reep1 n = 40; controls n = 40). (E,E’) Lateral tail views at 120 hpf of whole-mount larvae labeled with anti-znp1 (MO ATG reep1 n = 40; controls n = 40). (F,F’) Mitochondrial respiratory analysis of controls (n = 20) and reep1 morphant larvae (n = 20) at 120 hpf. Statistics were calculated by Mann–Whitney test in panels (A,C,F), whereas in panel (B) by two-tailed unpaired t-test. * p < 0.05, ** p < 0.01, ***p < 0.001; **** p < 0.0001, ns, not significant.