Figure 1
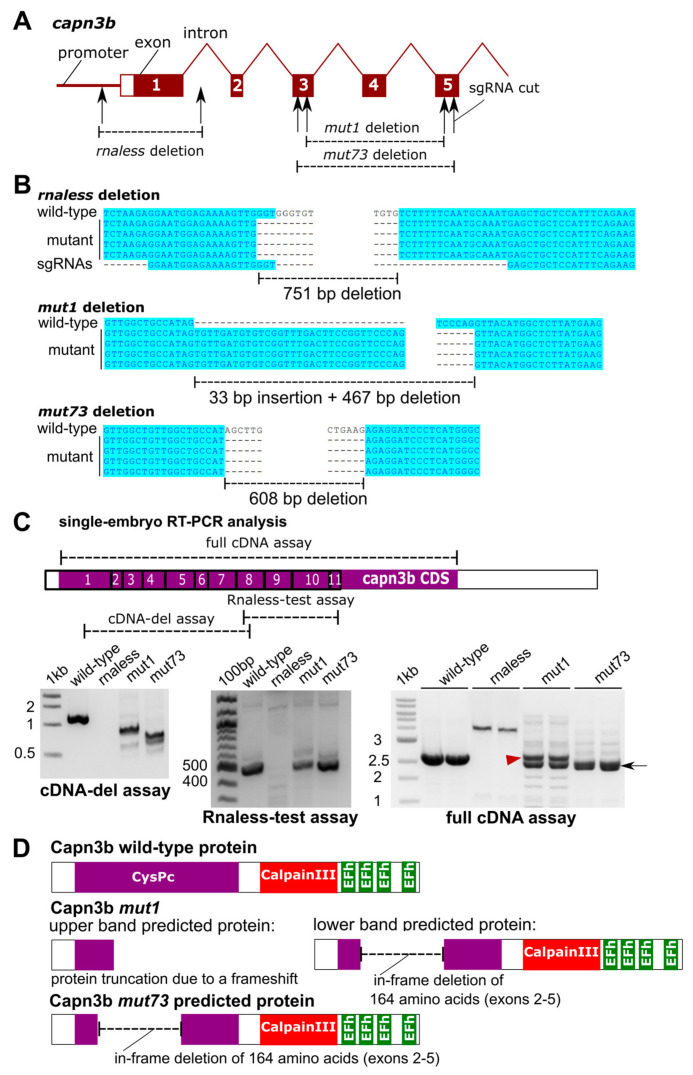
Generation and molecular characterization of the capn3b mutants. (A) Structure of the capn3b gene, including the promoter region, the first 5 exons, and introns. The targeted regions are shown where deletions were generated by the indicated sgRNAs. (B) Genomic sequencing of the deletion alleles and their alignment to the wild-type sequence. (C) Reverse transcription polymerase chain reaction (RT-PCR) analysis of capn3b transcripts in single-embryo cDNA samples of indicated genotypes. The regions of the capn3b mRNA analyzed by these assays are indicated in the diagram. Exon numbers are in the boxes. The bands in the mut1 and mut73 RT-PCR are indicated with a red arrowhead (upper band) and a black arrow (lower band). (D) Sequencing of the RT-PCR products of the full cDNA assay allowed protein-level interpretation of the identified mutations, as illustrated using protein domain diagrams.

