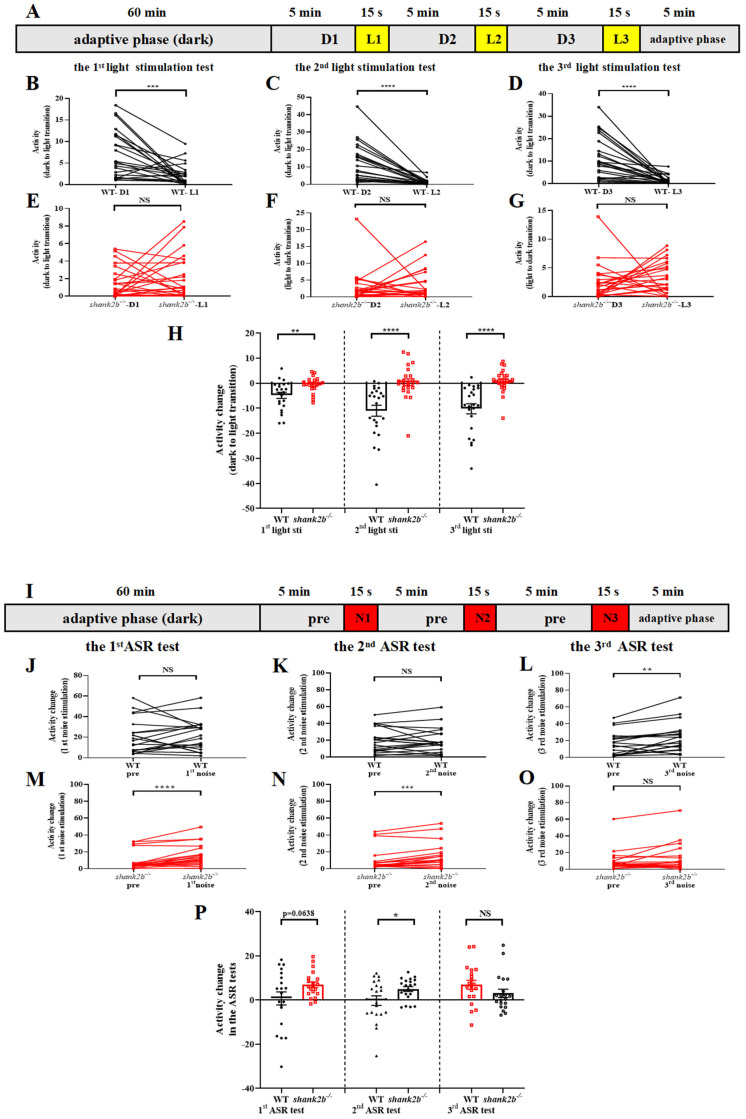
Figure 3
Abnormal response to visual and auditory stimuli in shank2b larva. (A) Scheme and behavioral setup applied for locomotor activity tracking in VMR response to light stimulation of zebrafish larvae at 13 dpf. The experiment consisted of a 60-min adaptation period under continuous dark and a 20 min 45 s testing period consisting of three VMR. The VMR experiment consisted of 5 min of conditioning to darkness and 15 s of stimulation by a sudden light stimulus. (B–D) WT larvae at 13 dpf exhibited normal decrease in response to sudden light stimuli (1st light stimuli, *** p = 0.0006; 2nd light stimuli, **** p < 0.0001; 3rd light stimuli, **** p < 0.0001. n = 23, paired t test), (E–G) whereas shank2b−/− models showed completely different response during dark–light transitions, characterized by dynamic slight increases in activity without statistical significance (1st light stimuli, ns p = 0.3395; 2nd light stimuli, ns p = 0.7621; 3rd light stimuli, ns p = 0.3446. n = 24, paired t test). (H) Column plots compare activity detected during the 1 min before and the 15 s after each light stimulation exposure between WT and shank2b mutants. Each transition from dark to light induced significant difference in activity change between WT and shank2b larva (1st light stimuli, ** p = 0.0029; 2nd light stimuli, **** p < 0.0001; 3rd light stimuli, **** p < 0.0001. WT, n = 23, shank2b−/− n = 24, Student’s t test). Data are presented as the mean ± SEM. (I) Scheme and behavioral setup applied for locomotor activity tracking in AMR response to loud noise stimulation of zebrafish larvae at 13 dpf. The experiment consisted of a 60 min adaptation period and a 20 min 45 s testing period consisting of three AMR tests. An AMR experiment consisted of 5 min of conditioning to ambient sound and 15 s of stimulation by a sudden loud noise. (J–L) WT larvae at 13 dpf exhibited a significant and robust increase in activity induced by the third exposure to the sudden noise stimulus after twice being exposed to ASR assays (1st noise stimuli, ns p = 0.8148; 2nd noise stimuli, ns p = 0.8905; 3rd noise stimuli, ** p = 0.0028. n = 20, paired t test). (M–O) The first and second noise stimuli induced significant increase in activity of shank2b−/− larvae (1st noise stimuli, **** p < 0.0001; 2nd noise stimuli, *** p = 0.0003; 3rd noise stimuli, ns, p = 0.1257. n = 20, paired t test). (P) Column plots compare activity detected during the 1 min before and the 15 s after each loud noise stimulation exposure between WT and shank2b mutants. Similarly, in first two sudden loud noise stimulations, the velocity change of shank2b larva at 13 dpf was more dramatic than that of the WT larvae (1st noise stimuli, p = 0.0638; 2nd noise stimuli, * p = 0.0369; 3rd dark noise, ns p = 0.1645. WT n = 20, shank2b−/− n = 20, Student’s t test). Data are presented as the mean ± SEM.

