IMAGE

Fig. 2

ID
ZDB-IMAGE-230211-23
Source
Figures for Zhang et al., 2023
Image
Figure Caption

Fig. 2

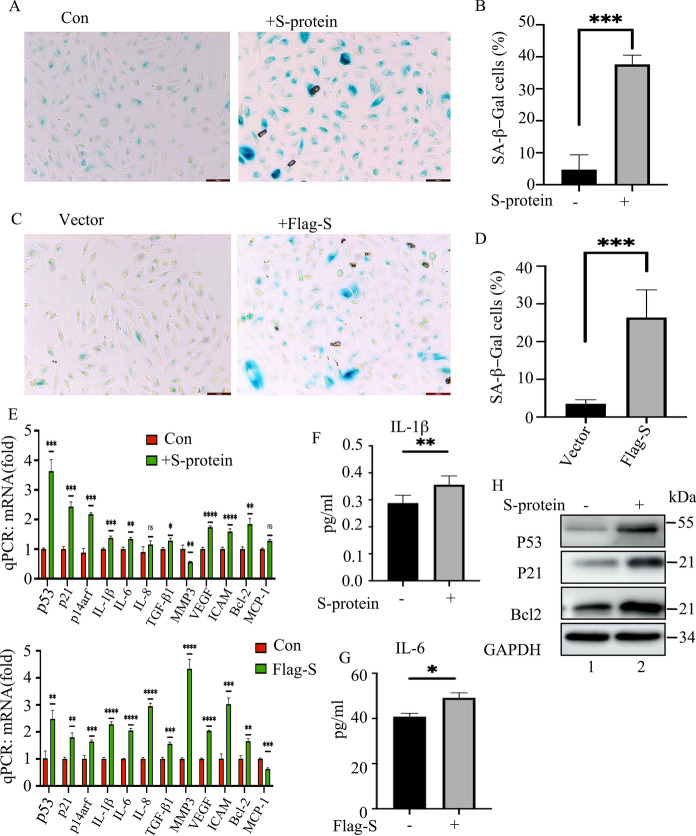
S-protein induces senescence of ARPE-19 cells. A SA-β-Gal staining of ARPE-19 cells that were treated with media containing PBS (Con) or S-protein for 48 h. B Quantitation of the percentage of SA-β-Gal positive cells per view in A. Ten views were used for quantitation, and the experiment was repeated three times. The data represent mean ± SD, n = 3, ***p < 0.001. C SA-β-Gal staining of the ARPE-19 cells that express empty vector or p3xFlag-S respectively for 48 h. D Quantitation of the percentage of SA-β-Gal positive cells/ total cells/view (a total of 10 views were used for quantitation). The data represent mean ± SD (n = 3), ***p < 0.001. E qPCR to quantitate the expression of cell cycle inhibitors (P53, p21, and p14arf), cytokines (IL-1β, IL-6, IL-8, MCP-1, TGF-β1), MMP3, and iCAM in the cells treated in A and C. F and G ELISA to measure the secretion of IL-1β and IL-6 in ARPE-19 cells that were treated with S-protein for 48 h. H Immunoblot of the expression of p53, p21, Bcl-2, and GAPDH in ARPE-19 cells that were treated with S-protein for 48 h

Acknowledgments
This image is the copyrighted work of the attributed author or publisher, and ZFIN has permission only to display this image to its users. Additional permissions should be obtained from the applicable author or publisher of the image. Full text @ Biogerontology