
|
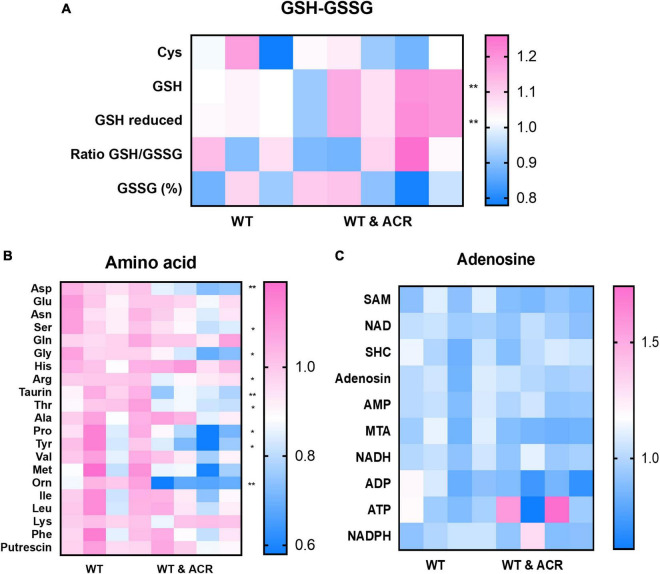
FIGURE 7
Metabolomic screening displayed several alterations in acrolein (ACR) treated zebrafish larvae at 5 dpf. (A–C) Heatmaps showed the metabolomic screening of thiols panel (A), amino acids panel (B) and adenosines panel (C) in WT and WT & ACR zebrafish larvae at 5 dpf: panel (A) Glutathione (GSH) and reduced GSH showed significant increase in WT & ACR zebrafish; panel (B). Several amino acids displayed significant reduction after treatment with ACR; panel (C). No changes in adenosine levels were identified in WT & ACR larvae as compared to WT larvae; n = 4 clutches with 50 larvae, for statistical analysis Student’s t-test was applied; *p < 0.05, **p < 0.01. dpf, day post fertilization.