
Image
|
Figure Caption
Fig. 3
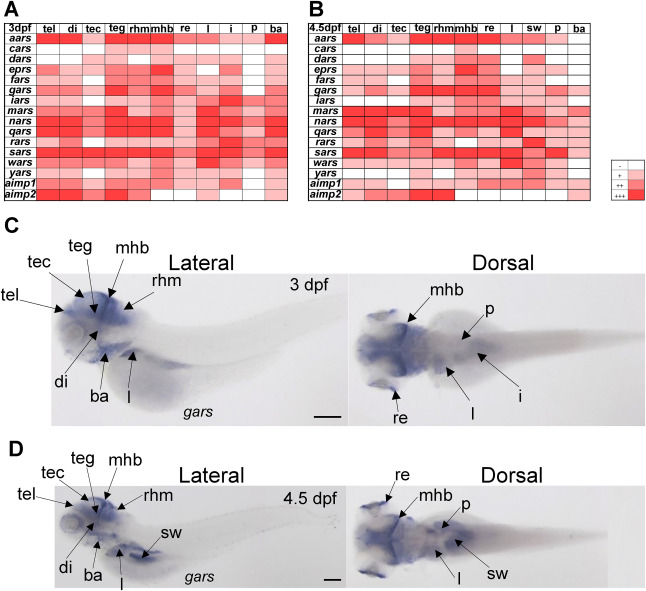
Fig. 3. An expression heatmap of 14 ars and 2 aimp genes at 3 and 4.5 dpf. (A, C) An expression heatmap for all 16 genes at 3 dpf (A) and 4.5 dpf (C). (B, D) gars expression as representative images at 3 dpf (B) and 4.5 dpf (D). Scale bar = 200 μm. (refer to the list of abbreviations for the name of tissues).
Figure Data
Acknowledgments
This image is the copyrighted work of the attributed author or publisher, and
ZFIN has permission only to display this image to its users.
Additional permissions should be obtained from the applicable author or publisher of the image.
Full text @ Biochem. Biophys. Res. Commun.