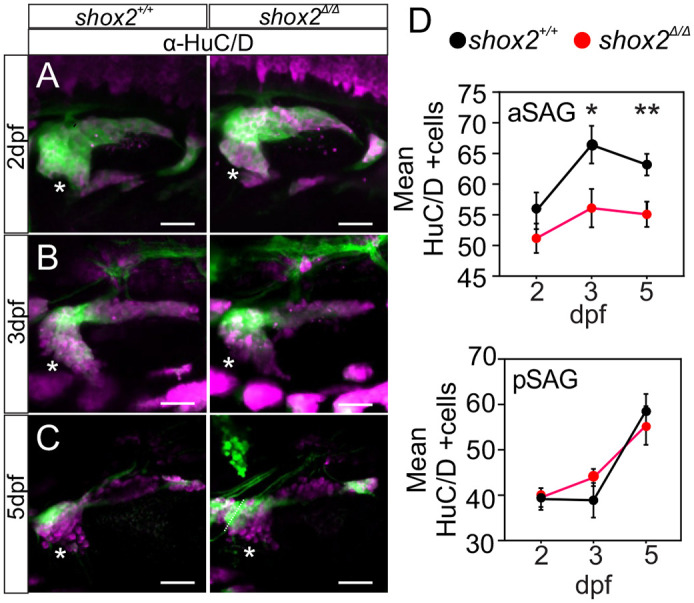
Fig. 4. Comparing number of SAG between shox2+/+ and shox2Δ/Δ animals. HuC/D immunostaining of shox2+/+ and shox2Δ/Δ larvae that contain the Tg(neurod1: EGFP) reporter at (A) 2, (B) 3 and (C) 5 dpf. EGFP (green) and HuC/D (magenta) are shown. Asterisks mark the anterior SAG (aSAG). (D) HuC/D cell counts from aSAG are as follows: 2 dpf, shox2+/+ (55.7±3.0 cells, n=12 larvae), shox2Δ/Δ (51.2±2.4 cells, n=11 larvae), 3 dpf, shox2+/+ (66.4±3.1 cells, n=10 larvae), shox2Δ/Δ (56.1±3.1 cells, n=11 larvae), 5 dpf, shox2+/+ (63.2±1.8 cells, n=11 larvae), shox2Δ/Δ (55.1±2.1 cells, n=12 larvae). (E) HuC/D cell counts from posteromedial SAG (pSAG) are as follows: 2 dpf, shox2+/+ (39.5±1.9 cells, n=15 larvae), shox2Δ/Δ (39.1±1.8 cells, n=14 larvae), 3 dpf, shox2+/+ (38.9±3.8 cells, n=10 larvae), shox2Δ/Δ (43.9±1.9 cells, n=11 larvae), 5 dpf, shox2+/+ (58.6±3.7 cells, n=13 larvae), shox2Δ/Δ (55.4±4.3 cells, n=14 larvae). One-way ANOVA and Sidak multiple comparison test were used. *P≤0.05, **P≤0.01. Values reported as mean±s.e.m. Scale bars: 10 µm.
Image
Figure Caption
Figure Data
Acknowledgments
This image is the copyrighted work of the attributed author or publisher, and
ZFIN has permission only to display this image to its users.
Additional permissions should be obtained from the applicable author or publisher of the image.
Full text @ Biol. Open

