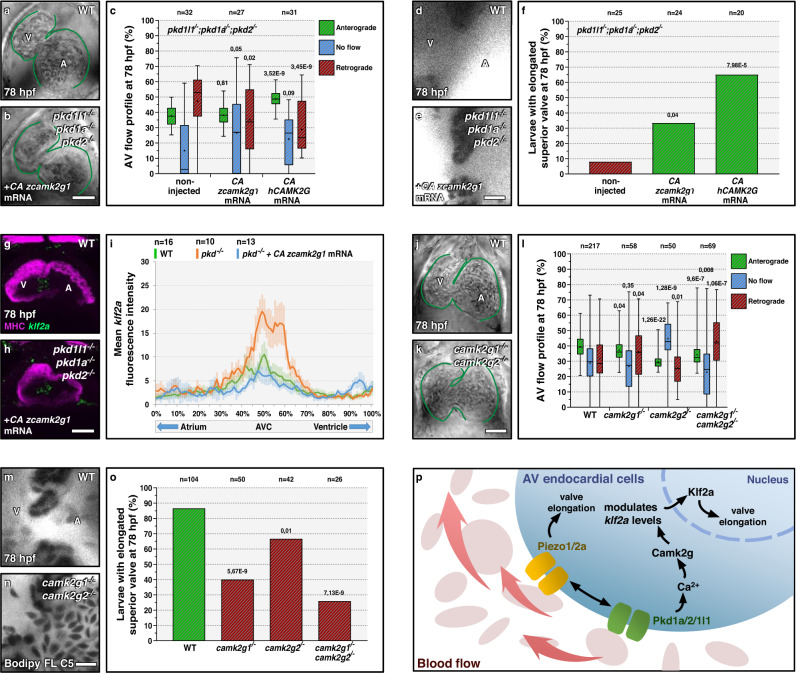
Fig. 6
a, b Brightfield images of 78 hpf hearts from non-injected pkd triple mutant (a) or injected at the one-cell stage with mRNA encoding a CA zCamk2g1 (b). c AV flow profile of 78 hpf pkd triple mutant larvae non-injected or injected at the one-cell stage with mRNA encoding CA zCamk2g1 or CA hCAMK2G. d, e Confocal imaging of hearts from 78 hpf non-injected pkd triple mutant (d) or injected at the one-cell stage with mRNA encoding CA zCamk2g1 (e) and stained with Bodipy. f Superior AV valve elongation of 78 hpf non-injected pkd triple mutants or injected at the one-cell stage with mRNA encoding CA zCamk2g1 or hCAMK2G. g, h Confocal projections of hearts from 78 hpf wild-type (g) and pkd triple mutant injected at the one-cell stage with mRNA encoding CA zCamk2g1 (h), stained for MHC and klf2a expression. i klf2a fluorescence intensity along the heart tube in 78 hpf wild types and pkd triple mutants non-injected or injected at the one-cell stage with mRNA encoding CA zCamk2g1. j, k Brightfield images of 78 hpf wild-type (j) and camk2g1/2 double mutant (k) hearts. l AV flow profile of 78 hpf wild-type, camk2g1 mutant, camk2g2 mutant, and camk2g1/2 double mutant larvae. m, n Confocal imaging of 78 hpf wild-type (m) and camk2g1/2 double mutant (n) hearts stained with Bodipy. o Superior AV valve elongation of 78 hpf wild types and camk2g1/2 mutants. p Model summarizing the mechanosensory control of AV valve elongation. Hearts are oriented, annotated, and imaged as in Fig. 1. The box-and-whisker plots in c, l represent the same type of data as in Fig. 1g. The center of the bar represents the mean in f, o. P values are calculated using a two-sided Student’s t-test in c, l; a Fisher’s exact test in f, o; and are relative to wild type. Error bars indicate SEM in i. Scale bars: 50 µm in a, b, g, h, j, k; 10 µm in d, e, m, n. Source data are provided as a Source Data file.

