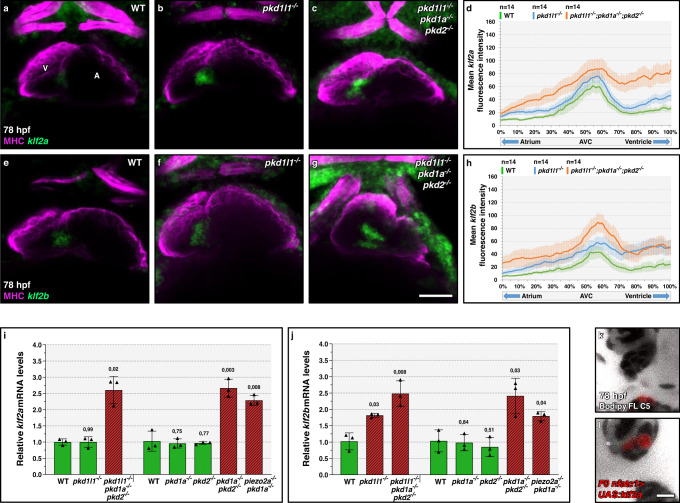
Fig. 5
a–c, e–g Confocal projections of 78 hpf wild-type (a, e), pkd1l1 mutant (b, f), and pkd triple mutant (c, h) hearts stained for MHC, and klf2a (a–c), or klf2b (e–g) expression; ventral views, anterior to the top, ventricle (V) on the left, and atrium (A) on the right. d, h klf2a (d) and klf2b (h) mean fluorescence intensity along the heart tube in 78 hpf wild-type, pkd1l1 mutant, and pkd triple mutant larvae. i, j Relative mRNA levels of klf2a (i) and klf2b (j) in 78 hpf wild-type, pkd1l1 mutant, pkd1a mutant, pkd2 mutant, pkd1a; pkd2 double mutant, pkd triple mutant, and piezo2a; pkd1a double mutant dissected hearts; n = 3 biologically independent samples; Ct values are listed in Supplementary Data 1. k, l Confocal imaging of 78 hpf nfatc1:Gal4FF larvae injected at the one-cell stage with a plasmid encoding a UAS:klf2a-p2a-dTomato, presenting negative (k) or positive (l) superior valve cells, and stained with Bodipy FL C5-Ceramide; 32/34 of the negative larvae and 5/13 of the positive larvae display an elongated superior valve; AV canal magnified images. Hearts imaged in ventral view, anterior to the top, ventricle (V) on the left, and atrium (A) on the right. The center of the error bar represents the mean in i, j. Error bars indicate SEM in d, h; s.d. in i, j. P values were calculated using a two-sided Student’s t-test in i, j and are relative to the wild type. Scale bars: 50 µm in a–c, e–g; 10 µm in k, l. Source data are provided as a Source Data file.

