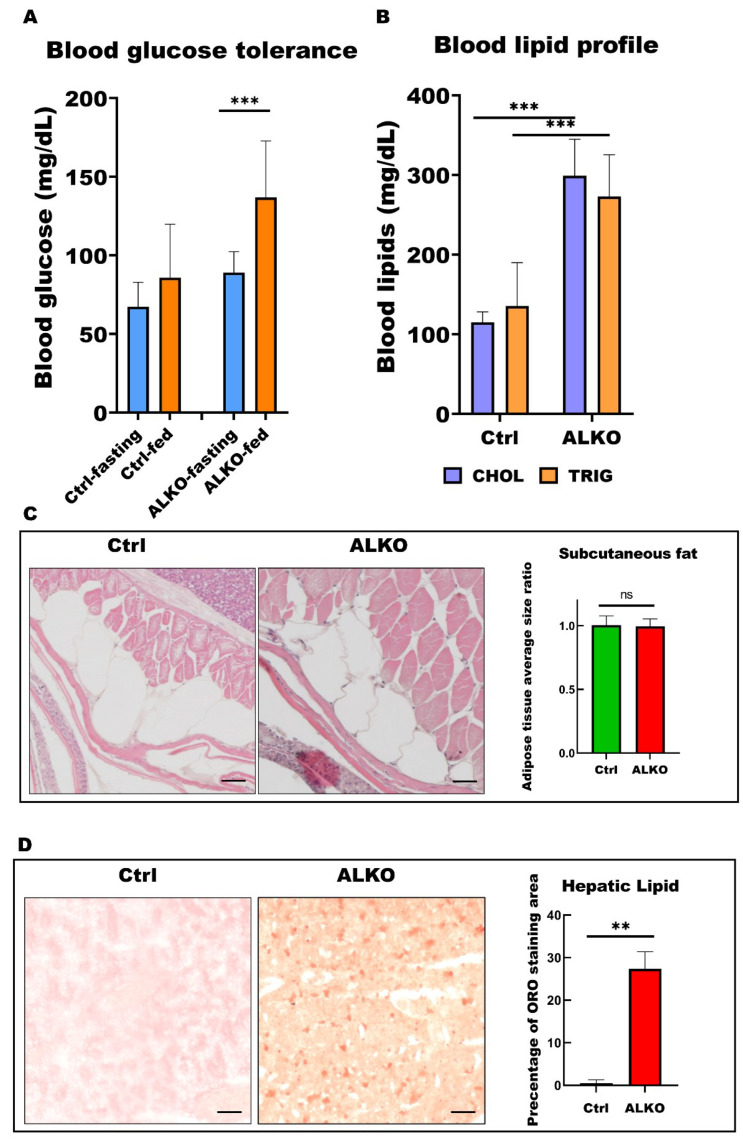
Figure 3 ALKO presented a typical metabolic syndrome outcome in adult. (A) Blood glucose contents of control and ALKO adults 5-month post-fertilization (mpf) at fasting and 90 mins after feeding. Values of Ctrl-fasting = 67.3636 ± 15.4872, Ctrl-fed = 85.75 ± 34.0619, ALKO-fasting = 89 ± 13.2581, and ALKO-fed = 136.833 ± 35.9415. (B) Blood lipid contents of control and ALKO adults at 5 mpf. CHOL: Total cholesterol content (mg/dL); TRIG: Total triglyceride content (mg/dL). Values of CHOL in Ctrl = 115 ± 13.2288, and ALKO = 299 ± 45.9239. Values of TRIG in Ctrl = 135.667 ± 54.3722, and AKOL = 273 ± 52.5071. (C) Characterization of subcutaneous fat in ALKO and control at 5 mpf. Scale bar: 50 μm. Values of adipose tissue average size ratio in Ctrl = 1.0041 ± 0.0738, and ALKO = 0.9946 ± 0.0595. (D) Histological images of hepatic ORO sections revealed a non-alcohol fatty liver phenotype in ALKO at 5 mpf. Scale bar: 50 μm. Percentage of ORO staining area in Ctrl = 0.481 ± 0.7925, and ALKO = 27.356 ± 4.0251. Statistically significant differences from the controls are indicated by ** p < 0.01, and *** p < 0.001.
Image
Figure Caption
Figure Data
Acknowledgments
This image is the copyrighted work of the attributed author or publisher, and
ZFIN has permission only to display this image to its users.
Additional permissions should be obtained from the applicable author or publisher of the image.
Full text @ Int. J. Mol. Sci.

