
|
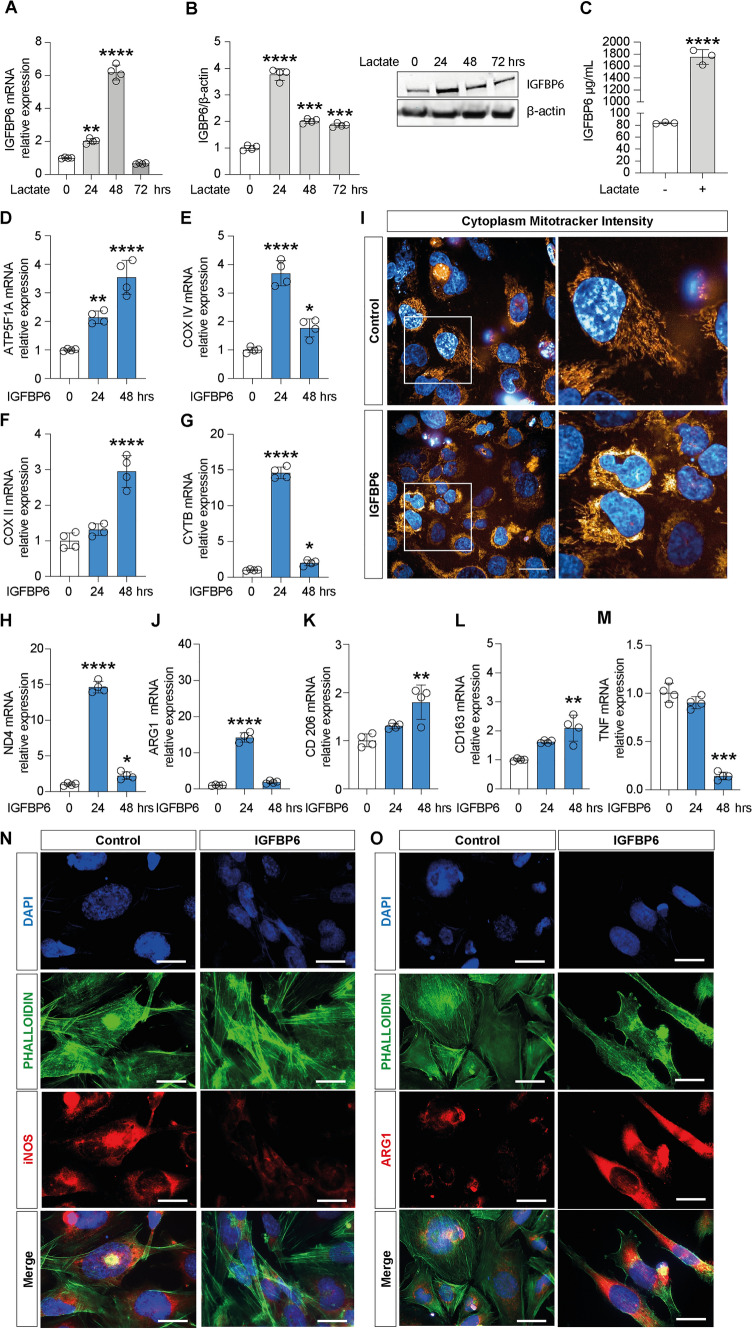
Fig. 2
Lactate induces IGFBP6 expression which promotes M2-like phenotype polarization of microglia. Effect of lactate on IGFBP6 A mRNA expression levels, B protein expression and C production in microglia cells. Evaluation of relative mRNA expression levels of D ATP5F1A, E COX IV, F COX II, G CyTB, H ND4. I Cytoplasm Mitotracker Intensity. Evaluation of relative mRNA expression levels of J Arg1, K CD 206, L CD 163 and M TNF, analyzed by real-time PCR. The calculated value of 2−ΔΔCt in untreated controls is 1. Immunocytochemistry analysis of N iNOS and O Arg1, following 72 h of IGFBP6 treatment. Data are expressed as mean ± SD of at least four independent experiments. (*P < 0.05; **P < 0.005; ***P < 0.001; ****P < 0.0001). Scale bars in (I, N and O) 10 μm