Figure 5
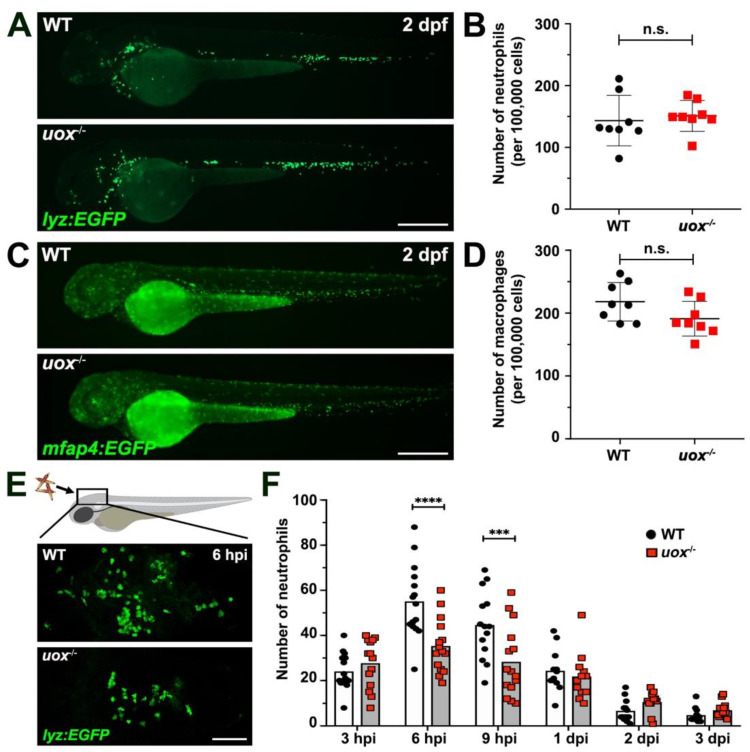
Uricase-deficient larvae demonstrate unaltered myelopoiesis and dampened neutrophil recruitment towards MSU crystal challenge. (A) Live imaging of neutrophils within 2 day post fertilization (dpf) WT and uox−/− Tg(lyz:EGFP) larvae. (B) Flow cytometry quantification of neutrophils within 2 dpf WT and uox−/− Tg(lyz:EGFP) larvae (n = 8 groups per genotype, 20 larvae per group). (C) Live imaging of macrophages within 2 dpf WT and uox−/− Tg(mfap4:EGFP) larvae. (D) Flow cytometry quantification of macrophages within 2 dpf WT and uox−/− Tg(mfap4:EGFP) larvae (n = 8 groups per genotype, 20 larvae per group). Statistical significance in (B,D) determined using unpaired two-tailed Student’s t tests. (E) Immunofluorescent detection of neutrophils within the hindbrain ventricle of WT and uox−/− Tg(lyz:EGFP) larvae, at 6 h post MSU crystal injection (hpi). (F) Quantification of neutrophil recruitment, as detected in (E), within WT (white bars) and uox−/− (grey bars) Tg(lyz:EGFP) larvae at 3, 6 and 9 hpi and 1, 2 and 3 days post MSU crystal injection (dpi), n = 12–15 larvae per treatment. Statistical significance determined using multiple unpaired Student’s t-tests with Holm–Sidak correction. Error bars in (B,D,F) represent means ± SDs. Abbreviations: n.s. not significant, *** p < 0.001 and **** p < 0.0001. Scale bars: 200 µm in (A,C,E).

