IMAGE

Fig. 7.

ID
ZDB-IMAGE-221226-134
Source
Figures for Do et al., 2022
Image
Figure Caption

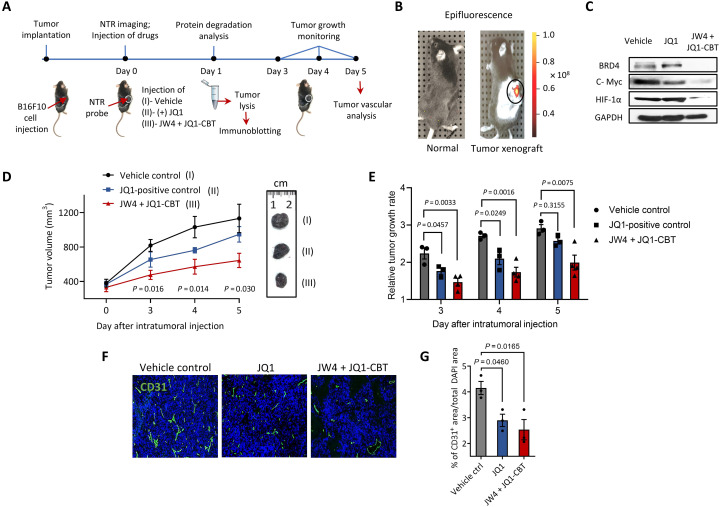
Fig. 7. Tumor inhibition by ENCTACs assisted BRD4 degradation.

(A) Schematic diagram shows the treatment of ENCTACs in the mouse melanoma xenograft model. (B) Fluorescence image of NTR activity in solid tumor. Near-infrared fluorescence reporter was intratumorally injected, and the image was taken 30 min later. (C) Immunoblot for BRD4, c-Myc, HIF-1α, and GAPDH in tumor lysates collected from mice treated with JW4 and JQ1-CBT (5 mg/kg) mixture, JQ1 (5 mg/kg) alone, or vehicle twice for 4 hours. (D) Representative pictures and quantitative analysis of tumor volume (means ± SD) of vehicle-treated mice (n = 3) or mice treated with JW4, JQ1-CBT mixture (5 mg/kg; n = 4), or JQ1-treated mice (n = 3) for 5 days. (E) Relative tumor growth rate under different treatments as indicated for 5 days. (F) Immunohistochemistry staining with a vascular marker CD31 (green) and nucleus marker 4′,6-diamidino-2-phenylindole (DAPI) (blue) of tumors subjected to ENCTACs, (+)-JQ1, or vehicle control. (G) Quantification of total vascular area in tumors subjected to ENCTACs, (+)-JQ1, or vehicle control.

Acknowledgments
This image is the copyrighted work of the attributed author or publisher, and ZFIN has permission only to display this image to its users. Additional permissions should be obtained from the applicable author or publisher of the image. Full text @ Sci Adv