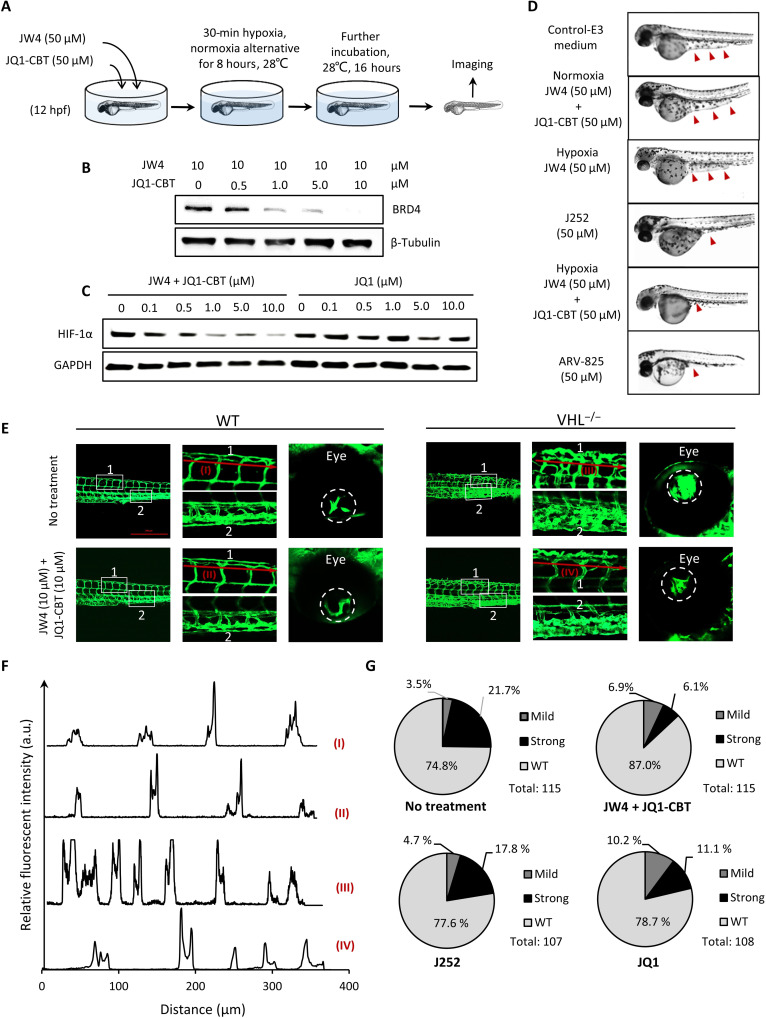
(A) Scheme of zebrafish early treatment with hypoxia-activated ENCTACs. (B) Western blot analysis of BRD4 level in hypoxia zebrafish after treatment with different concentrations of ENCTAC molecules. (C) Western blot analysis of HIF-1α level in hypoxia zebrafish upon treatment with different concentrations of ENCTAC molecules or with inhibitor JQ1. (D) Bright-field images of zebrafish embryos under different conditions of indicated drug treatment at 36 hpf. Red arrowheads indicate yolk extension area. (E) Fluorescent imaging of zebrafish larvae phenotype with blood vessel trackers (fli1:eGFPy1) in wild-type (WT), and von Hippel–Lindau (vhl) mutant (vhl−/−) larvae with and without ENCTAC treatment. Blood vessel tracker (green), λex = 488 nm and λem = 520/30 nm. Scale bar, 500 μm. (F) Fluorescent intensity spectra of blood vessel alignment along red line (I to IV) indicated in (E). (G) Statistical numbers of vascularization phenotypes in zebrafish larvae with and without ENCTAC treatments or with PROTAC, J252, or inhibitor JQ1 (10 μM).
Acknowledgments
This image is the copyrighted work of the attributed author or publisher, and
ZFIN has permission only to display this image to its users.
Additional permissions should be obtained from the applicable author or publisher of the image.
Full text @ Sci Adv

