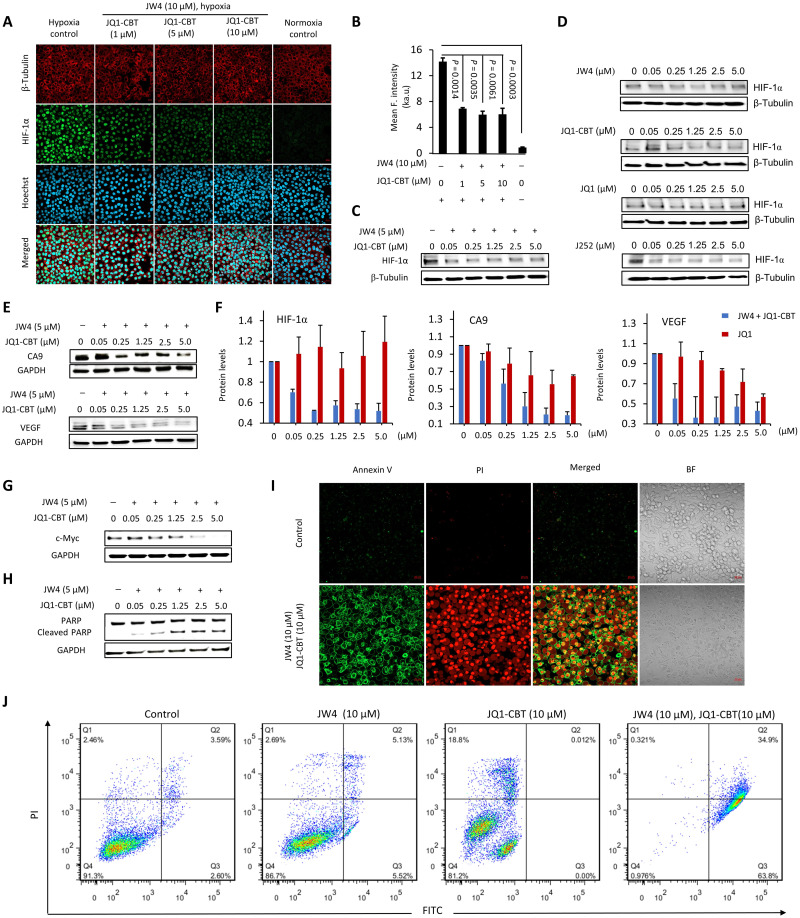
(A) Confocal imaging of HIF-1α immunostaining (green; λex = 488 nm and λem = 515/30 nm) after subjecting HeLa cells to the as-stated treatment. Nucleus was stained with Hoechst 33258 (blue; λex = 405 nm and λem = 460/50 nm), β-tubulin was stained with the fluorescent β-tubulin antibody (red; λex = 561 nm and λem = 617/20 nm). Scale bars, 40 μm. (B) Quantitative mean fluorescence intensity of HIF-1α after treatment and staining as indicated in (A). ka.u., kilo–arbitrary units. Values represent mean fluorescence intensity of three different cell areas ± SD. Western blot analysis of HIF-1α after treatment with different concentrations of JW4 and JQ1-CBT (C) or separated JW4, JQ1-CBT, JQ1, and J252 controls (12 hours) (D). (E) Western blot analysis of vascular endothelial growth factor (VEGF) and CA9 after hypoxia-activated ENCTAC treatment (12 hours). (F) Protein level of HIF-1α, VEGF, and CA9 after hypoxia ENCTAC (blue bar) and JQ1 inhibitor treatment (12 hours) (red bar). Values represent the average of duplicates and the range as error bars, normalized to nontreated cells, and baseline-corrected using immunoblots. (G) Immunoblot for c-Myc and glyceraldehyde-3-phosphate dehydrogenase (GAPDH) levels after hypoxia-activated ENCTAC treatment using JW4 and JQ1-CBT for 12 hours. (H) Immunoblot for poly(adenosine 5′-diphosphate–ribose) polymerase (PARP) cleavage and GAPDH levels after similar treatment condition as in (G). (I) Confocal imaging of apoptosis cell death staining with annexin V (AnnV)/propodium iodide (PI) [AnnV (green), λex = 488 nm and λem = 520/30 nm; PI (red), λex = 561 nm and λem = 590/30 nm]. Hypoxic cells without ENCTAC treatment as control. BF, bright field. Scale bars, 40 μm. (J) Flow cytometry of apoptosis/necrosis-stained HeLa cells under treatments with JW4, JQ1-CBT individually, or in combination of JW4 and JQ1-CBT (10 μM) (12 hours). Quarter 1 (Q1) indicates the relative percentage of necrosis cells, Q2 indicates late apoptosis cells, Q3 indicates early apoptosis cells, and Q4 indicates live cells.
Acknowledgments
This image is the copyrighted work of the attributed author or publisher, and
ZFIN has permission only to display this image to its users.
Additional permissions should be obtained from the applicable author or publisher of the image.
Full text @ Sci Adv