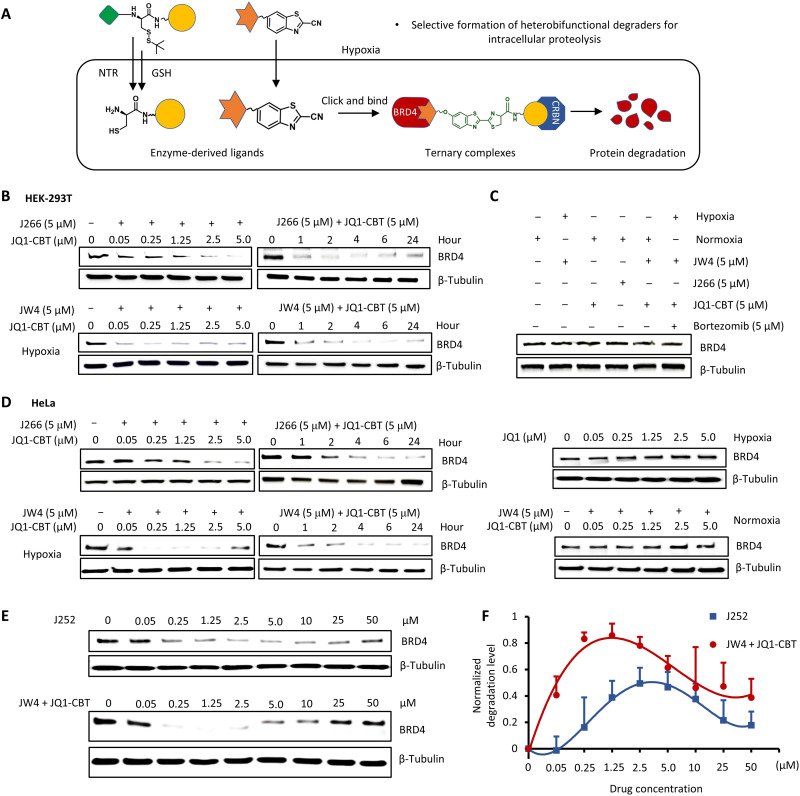
IMAGE

Fig. 4.

ID
ZDB-IMAGE-221226-130
Source
Figures for Do et al., 2022
Image
Figure Caption

Fig. 4. Hypoxia-activated degradation of epigenetic BRD4 protein.

(A) Illustration of intracellular hypoxic enzyme uncaging, formation of the degrader (click J252), and degradation of BRD4. (B) Western blot analysis of BRD4 protein levels after treatments with GSH-cleavable J266 (6 hours) and JQ1-CBT (12 hours) at indicated concentration and different time points; GSH- and NTR-responsive JW4 (6 hours) with JQ1-CBT (12 hours) at the indicated concentration and for a different time period under hypoxia in HEK-293T cells. (C) Analysis of BRD4 protein levels under the combination of different control conditions for 12 hours (the inhibitor bortezomib incubated with cells for 2 hours before the addition of JW4 and JQ1-CBT). (D) Western blot analysis of BRD4 protein levels after treatments with J266 (6 hours) and JQ1-CBT (12 hours) or JW4 (6 hours) and JQ1-CBT (12 hours) in time- and concentration-dependent examinations of HeLa cancer cells; analysis of BRD4 protein levels after treatments with JQ1 (12 hours) in a concentration-dependent manner of hypoxia HeLa cells; and JW4 (6 hours) and JQ1-CBT (12 hours) in normoxia HeLa cells. (E) Extended concentration of degraders demonstrating the hook effect during incubation under hypoxia (representative results from two to three biological replications). β-Tubulin was used as internal controls. (F) BRD4 degradation level over varied concentration as indicated in (E). Values represent triplicate means ± SD, normalized to nontreated cells, and baseline-corrected using immunoblots.

Acknowledgments
This image is the copyrighted work of the attributed author or publisher, and ZFIN has permission only to display this image to its users. Additional permissions should be obtained from the applicable author or publisher of the image. Full text @ Sci Adv