
|
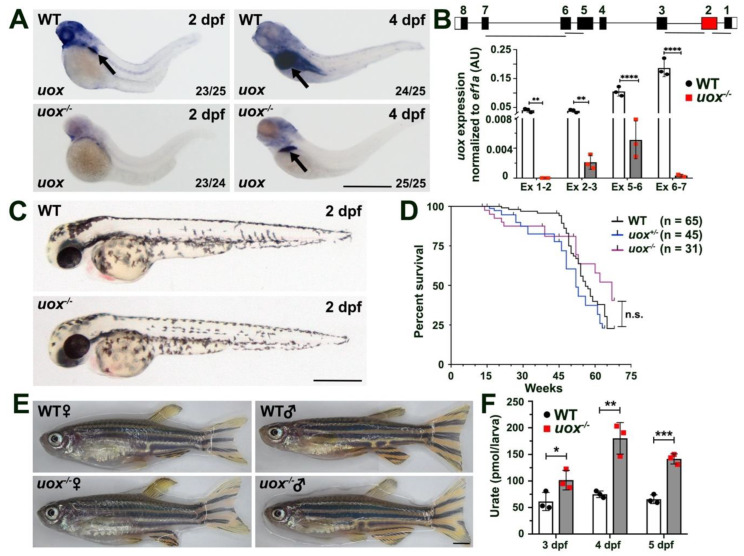
Figure 3
The +7 bp mutation in the uox gene results a null allele and uox−/− zebrafish are morphologically normal, fertile and possess elevated levels of urate. (A) Expression of uox in 2 and 4 day post fertilization (dpf) WT and uox−/− larvae, as detected by WMISH (arrows mark the liver). Numbers in the lower right corner of each panel indicate the frequency of larvae showing the displayed expression pattern. (B) Expression of uox in WT (white bars) and uox−/− (grey bars) larvae at 4 dpf, as detected by qPCR using four independent exon-spanning primer pairs (Ex 1-2, Ex 2-3, Ex 5-6 and Ex 6-7, as shown in schematic). Data generated from three biological replicates, n = 10 larvae per group. Schematic shows the location of the four primer pairs in the uox gene. Statistical significance determined using multiple unpaired Student’s t-tests with Holm–Sidak correction. (C) Representative brightfield images of WT and uox−/− larvae at 2 dpf. (D) Kaplan–Meier survival curve of WT, uox+/− and uox−/− fish from 1 month to 18 months of age. Statistical significance determined using the log-rank (Mantel–Cox) test. (E) Representative brightfield images of age-matched female and male WT and uox−/− adult fish. (F) Quantification of urate (pmol urate/larvae) from dissociated 3, 4 and 5 dpf WT (white bars) and uox−/− (grey bars) larvae, as detected using a Roche C311 autoanalyzer. Data generated from three biological replicates, n = 40 larvae per group. Statistical significance determined using multiple unpaired Student’s t-tests. Error bars in (B,F) represent means ± SDs. Abbreviations: n.s. not significant, * p < 0.05, ** p < 0.01, *** p < 0.001 and **** p < 0.0001. Scale bars: 500 µm in (A,C), 2 mm in (E).