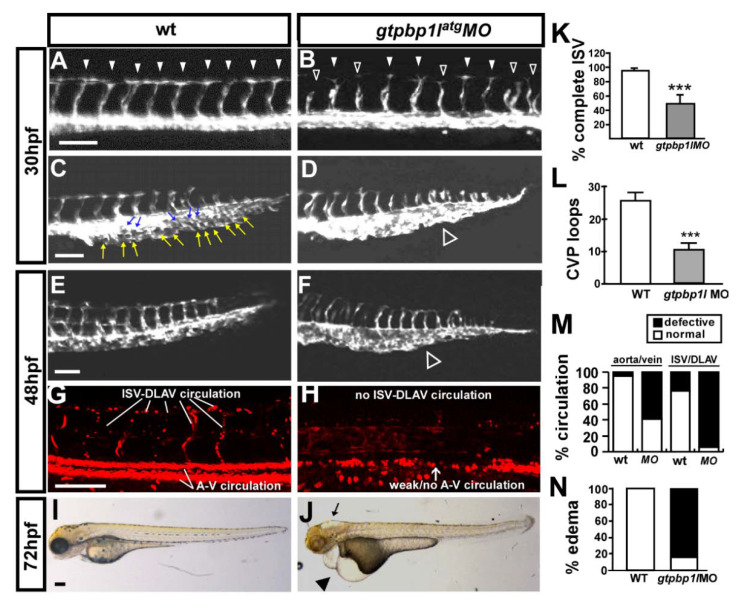
Figure 2
Knockdown of gtpbp1l causes vascular defects in zebrafish development. (A–D) Images of control and gtpbp1latg morpholino (3.4 ng)-injected Tg (flk:eGFP) embryos at 30 hpf. In the uninjected control, ISV reached the DLAV at the dorsal aspect of the embryo (arrowheads in (A)), and the CVP formed loop structures at the tail ((C), white and blue arrows). At the same stage, many ISVs showed slow growth at the mid-somite in gtpbp1latg morphants (hollow arrowheads in (B)) and less endothelial cell sprouting and nearly no loop formation at the CVP (white hollow arrowhead in (D)). (E–H) The injection of gtpbp1l morpholino into transgenic Tg (fli1a:eGFPy1; gata1:dsRedsd2) embryos showed that knockdown of gtpbp1l resulted in circulation defects at 48 hpf. At this stage, there was less CVP loop formation (hollow arrowhead in (F)) in MO embryos compared with controls (E). (I,J) At 72 hpf, gtpbp1latg morphants had pericardial edema (arrowhead in (J)). (K) The percentage of completed ISVs decreased by approximately 40% in gtpbp1latg morphants (n = 35 in wt and n = 32 in gtpbp1latg MO) at 30 hpf. (L) Quantification of CVP formation. (M) Quantification data showing that approximately 95% and 60% of gtpbp1l morphants at 48 hpf had poor blood flow in ISV–DLAV and in aorta–vein, respectively (n = 25 in control and n = 23 in gtpbp1latg MO). (N) Quantification of the percentage of pericardial edema was 85% in gtpbp1latg morphants (n = 26) compared to wt controls (n = 30) at 72 hpf. Data are mean ± S.D. *** indicates p < 0.0001 by unpaired Student’s t-test. Scale bar = 100 µm for (A–H) and 200 µm for (I,J).

