IMAGE

Figure 3

ID
ZDB-IMAGE-221220-17
Source
Figures for Xiao et al., 2022
Image
Figure Caption

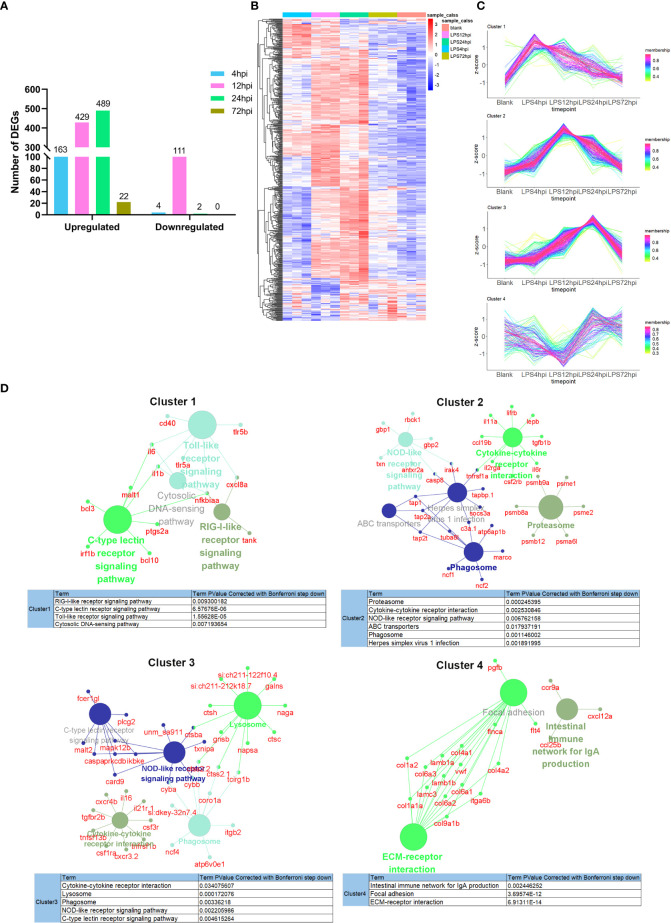
Figure 3

Transcriptomic traits of EIU in zebrafish. (A) Number of DEGs at 4 hpi, 12 hpi, 24 hpi and 72 hpi of LPS and saline. (B) Hierarchical clustering heatmap of DEGs at each time point. (C) The TCseq package was used to illustrate the patterns of dynamic changes in DEGs during EIU in zebrafish. (D) Functional enrichment analysis of DEGs in different clusters. Networks of pathways and genes in Cluster 1, Cluster 2, Cluster 3 and Cluster 4 were conducted by ClueGO and displayed by Cytoscape. Circles shown in the same color represent similar enrichment results.

Acknowledgments
This image is the copyrighted work of the attributed author or publisher, and ZFIN has permission only to display this image to its users. Additional permissions should be obtained from the applicable author or publisher of the image. Full text @ Front Immunol