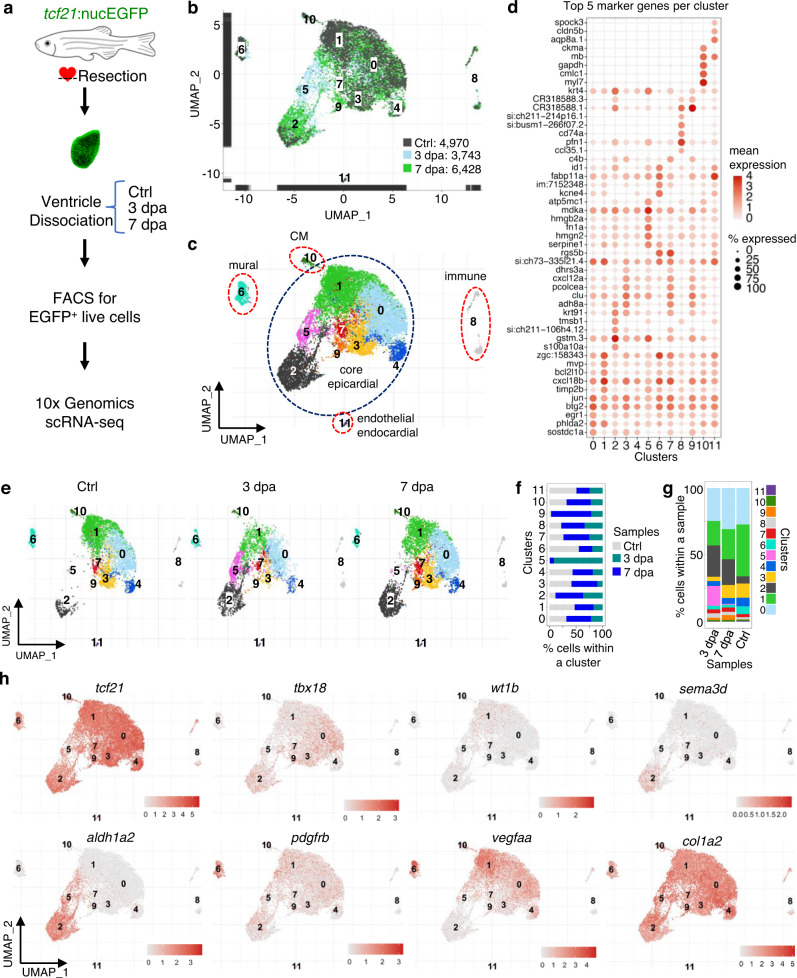
Fig. 2 a Experimental design for single epicardial cell isolation and transcriptome sequencing. b UMAP of three samples combined. After the removal of droplets with very few genes as well as genes that could not be detected in at least 5 cells, the final dataset comprised 4970, 3743, and 6428 cells for Ctrl, 3 dpa, and 7 dpa, respectively. c UMAP of cell clusters with inferred cellular identities. d Expression of top 5 cluster marker genes across different clusters. This dot plot depicts the abundance and expression magnitude of individual genes across cells of given clusters. The size of the dot represents the fraction of cells with at least one UMI of the specified gene. e UMAPs showing changes of clusters across samples. f Proportions of the samples per cluster. g Cluster proportions per sample. h Normalized expression of top marker genes on UMAPs (3 samples combined).
Image
Figure Caption
Figure Data
Acknowledgments
This image is the copyrighted work of the attributed author or publisher, and
ZFIN has permission only to display this image to its users.
Additional permissions should be obtained from the applicable author or publisher of the image.
Full text @ Nat. Commun.

