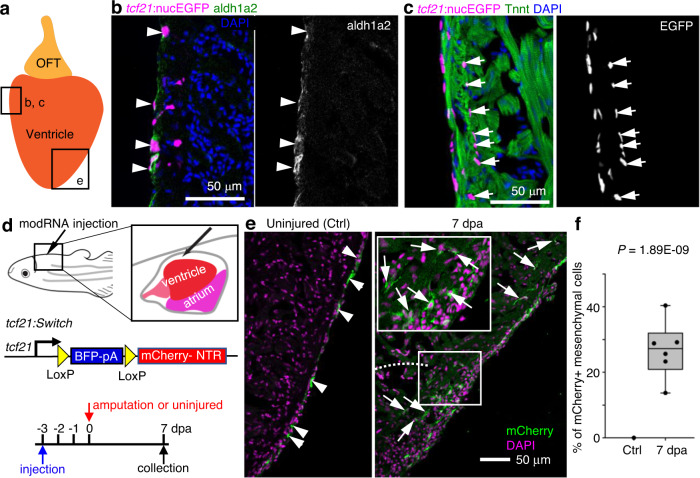
Fig. 1 a Cartoon of an adult zebrafish heart showing the ventricle and outflow tract (OFT). The frames indicate representative regions for cryosection-section images in b, c and e. b A cryosection image of an uninjured heart showing tcf21:nucEGFP in magenta, antibody staining against aldh1a2 in green. Nuclei were stained with DAPI (blue). A single-channel image of aldh1a2 signals is shown in grayscale on the right. Arrowheads indicate EGFP+adh1a2+ cells. Scale bar, 50 μm. c A cryosection image of an uninjured heart showing tcf21:nucEGFP in magenta, antibody staining against Tnnt in green. Nuclei were stained with DAPI (blue). A single-channel image of EGFP is shown in grayscale on the right. Arrows indicate EGFP+ mesenchymal epicardial cells. Scale bar, 50 μm. d Schematic of experimental design for modRNA injection. e Section images of uninjured (left) and 7 dpa (right) hearts carrying the tcf21:Switch reporter at 10 days post Cre modRNA injection. Arrows and arrowheads indicate representative mCherry+ mesenchymal and epithelial cells, respectively. Scale bar, 50 μm. f Quantification of mCherry+ mesenchymal epicardial cells in the experiment of e. The largest cryosection of each heart was quantified for mCherry+ cells in the apex half of the ventricle. n = 13 (Ctrl) and 6 (7 dpa), respectively. Two-tailed Student’s t test. The box plot shows the median (center line), upper and lower quartiles (box limits), minimum and maximum values (whiskers), and individual values (points). Source data are provided as a Source data file.
Image
Figure Caption
Figure Data
Acknowledgments
This image is the copyrighted work of the attributed author or publisher, and
ZFIN has permission only to display this image to its users.
Additional permissions should be obtained from the applicable author or publisher of the image.
Full text @ Nat. Commun.

