
|
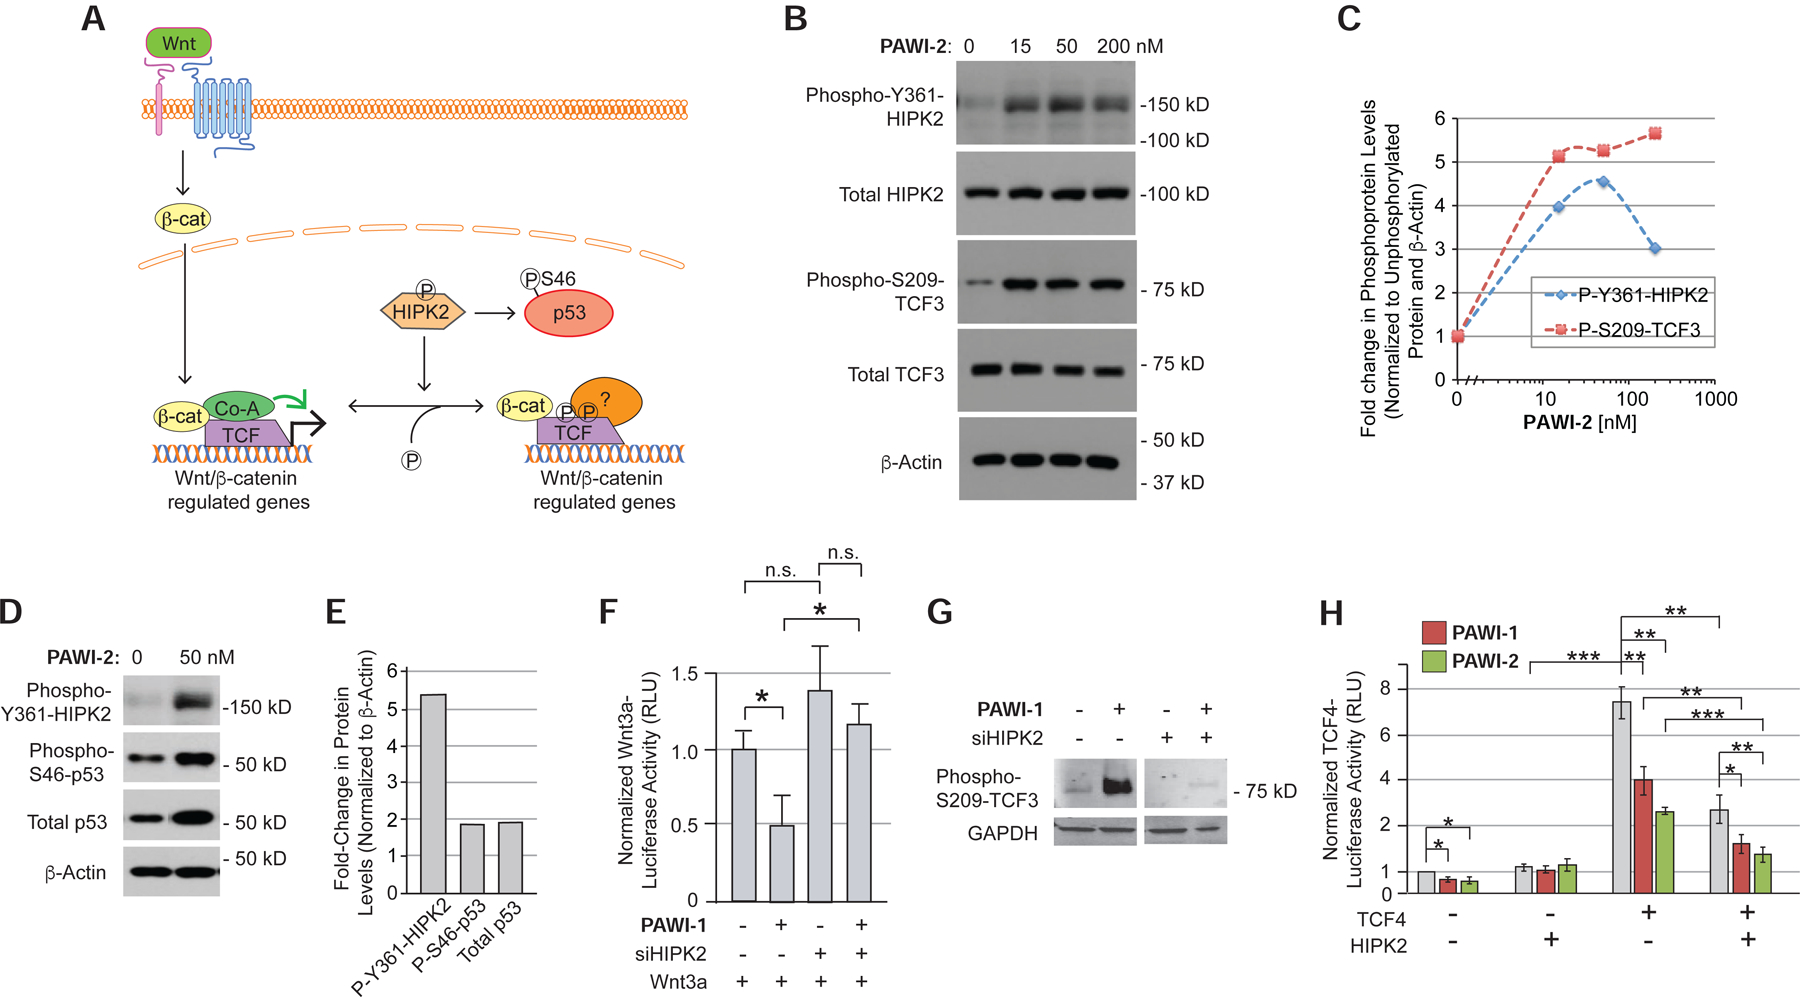
Fig. 3
A) Model of the role of HIPK2 in regulating the stabilization of p53 and the localization of TCF proteins on chromatin.
B,C) Effect of PAWI-2 (0–200 nM, for 4 hours) on Y361 phosphorylation of endogenous HIPK2 in non-transfected HEK293T cells and S209 phosphorylation of TCF3 in HEK293T cells transfected to express flag-tagged TCF3 (B) by Western blotting. Densitometry quantification is shown in (C).
D,E) Effect of PAWI-2 (50 nM) on S46 phosphorylation and total protein levels of p53, assayed as in (B).
F) Effect of siRNA knockdown of HIPK2 on the ability of PAWI-1 (200 nM) to inhibit Wnt3a/β-catenin signaling, as measured in HEK293T cells transfected with a TCF-luciferase reporter gene and treated with recombinant Wnt3a (10% conditioned media of HEK293T cells overexpressing Wnt3a). Error bars, s.e.m. (n=6).
G) Effect of siRNA knockdown of HIPK2 on the S209 phosphorylation of TCF3 in response to PAWI-1 (200 nM).
H) Effect of HIPK2 overexpression on PAWI-1 and PAWI-2 (50 nM) inhibition of TCF4 activity, as measured using a TCF-luciferase reporter in HEK293T cells. HIPK2, PAWI-1 and PAWI-2 inhibit TCF4-dependent signaling. Error bars, s.e.m. (n=3).
*, ** and *** indicate p-values <0.05, <0.01, and <0.001 respectively (T-test).