
Image
|
Figure Caption
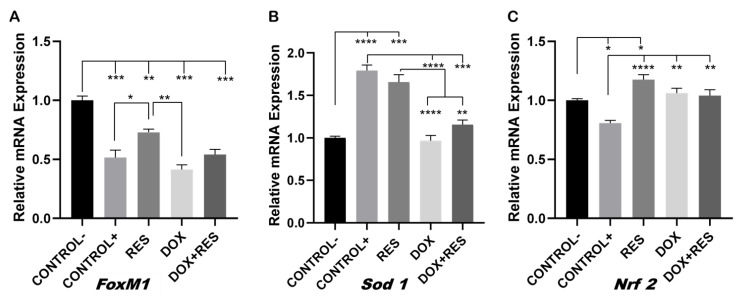
Figure 4 Involvement of FoxM1 on osteoclast differentiation and oxidative stress. RAW 264.7 cells were cultured for 4 days with M-CSF (30 ng/mL) and RANKL (50 ng/mL) and treated with resveratrol (RES), MitoTEMPO (MT) and doxorubicin (DOX) alone or together. RNA from the cells was obtained, and expression levels for FoxM1 (A), Sod 1 (B) and Nrf 2 (C) were analyzed by qPCR. One-way ANOVA, Tukey’s multiple comparisons test, *—p ≤ 0.05, **—p ≤ 0.01, ***—p ≤ 0.001, ****—p ≤ 0.0001.
Acknowledgments
This image is the copyrighted work of the attributed author or publisher, and
ZFIN has permission only to display this image to its users.
Additional permissions should be obtained from the applicable author or publisher of the image.
Full text @ Int. J. Mol. Sci.