
|
Fig. 5
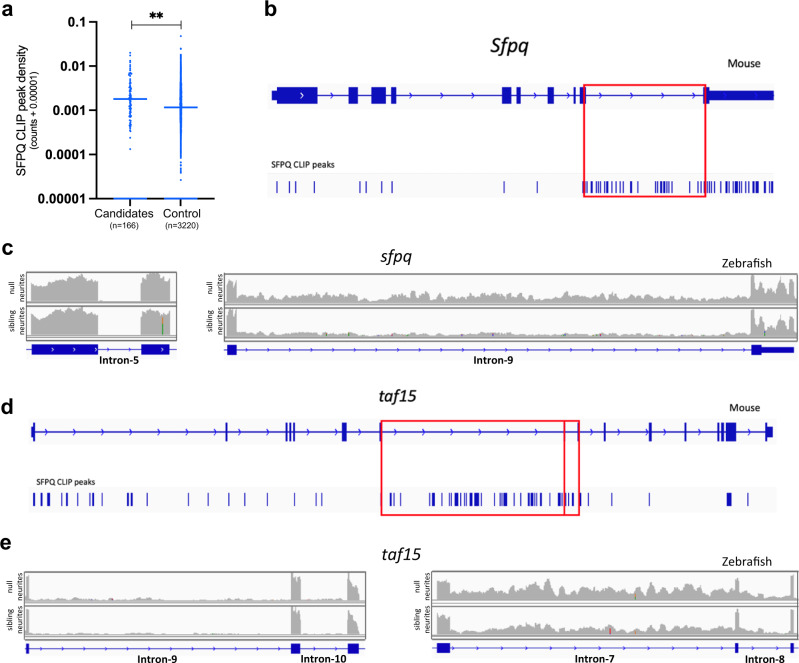
a CLIP analysis showing the extent of SFPQ binding to mouse homologues of ALS-associated introns. CLIP peak density scores normalise for intron length. Control introns are those not retained in the same genes as ALS-associated introns. Two-tailed Mann–Whitney test, **p < 0.0057. b Intronic CLIP peaks in Sfpq, most mapping to intron-9 (red box). c sfpq RNAseq reads of control intron-5 (Left) and retained intron−9 (Right) in sibling and null neurite samples. d CLIP peaks mapping to taf15. The vast majority of peaks that map to intronic sequences do so in intron-7 and intron-8 (red boxes). e taf15 RNAseq reads of control introns −9 & −10 (Left) and retained introns −7 & −8 (Right) in sibling and null neurite samples.