
|
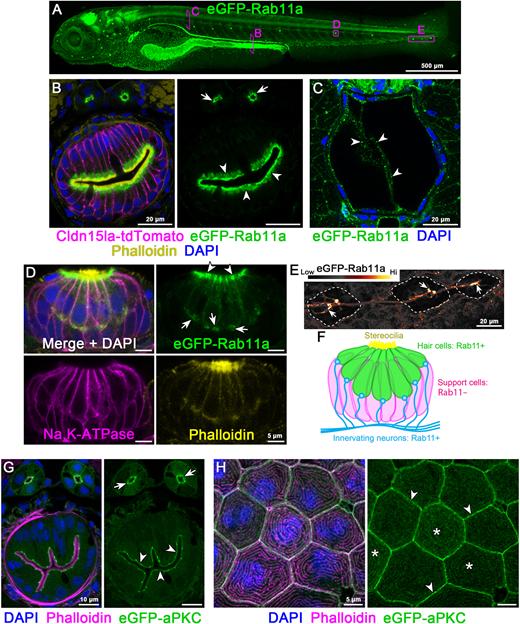
Fig. 3 Endogenous N-terminal tagging of Rab11a and aPKC. (A) Live 3D reconstruction of 5 dpf TgKI(eGFP-rab11a)pd1244 heterozygous larva. Magenta boxes show representative regions of interest for panels B-E. (B) Transverse section through the posterior mid-intestine (LREs, arrowheads) and pronephric ducts (arrows). (C) Transverse section through the notochord. Arrowheads, notochord vacuolated cells. (D) Whole-mount image of a neuromast. Arrowheads, apical cytoplasm; arrows, basal cytoplasm. (E) Live image of neurons innervating lateral line neuromasts (dotted line). Image is pseudo-colored according to the LUT scale shown. Arrows, neuronal tracts. (F) Schematic of Rab11a expression within neuromasts. (G,H) Transverse sections of TgKI(eGFP-prkci)pd1260 heterozygous larvae. (G) Transverse section of the mid-intestine. Arrowheads, IEC apical cortex; arrows, pronephric duct apical cortex. (H) Localization of eGFP-aPKC in periderm cells. Arrowheads, cell cortex; asterisks, apical microridges. Scale bars: 500 µm (A); 20 µm (B,C,E); 5 µm (D,H); 10 µm (G).