
|
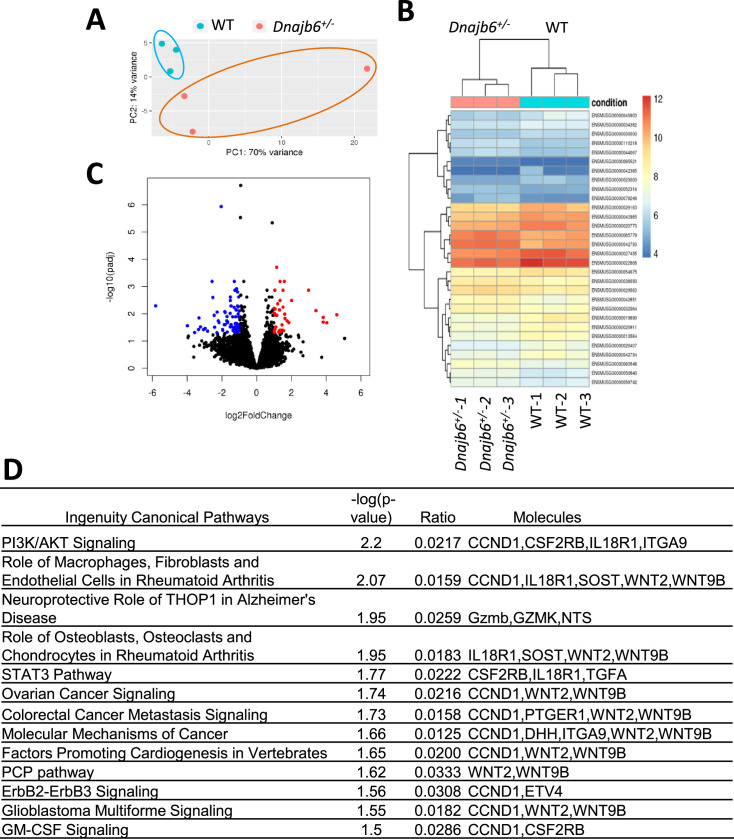
Figure 7—figure supplement 1. RNA sequencing identifies transcriptome changes in the Dnajb6+/- mice atrium.
(A) Principal component analysis (PCA) reveals the variance in transcriptome distribution in the Dnajb6+/- mice and WT controls at 6 months. Each point represents the projections of individual hearts onto principal component (PC). (B) Heatmap of genes differentially expressed in the Dnajb6+/- mice and WT controls. Each column represents an individual replicate and there are 3 replicates per group. Each row represents an individual gene. The color bar represents relative expression of log-transformed, normalized counts with upregulated genes shown in red and downregulated genes in blue. (C) Volcano plot shows magnitude and significance of genes that altered in distribution in the Dnajb6+/- mice and WT controls. Genes that significantly downregulated in the Dnajb6+/- mice are plotted in blue (left) and upregulated are plotted in red (right). (D) Ingenuity Pathway Analysis (IPA) of differentially expressed genes in the Dnajb6+/- mice and WT controls. Signaling pathways are organized in the order of significance as –log10 of P value.