
|
Fig 1
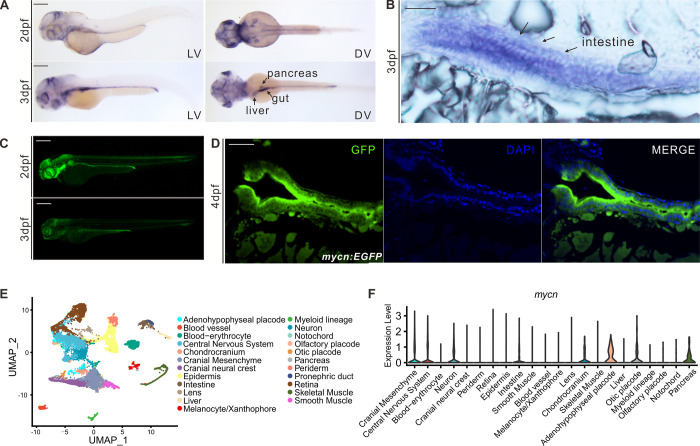
(A) Expression patterns of mycn in zebrafish at 2 and 3 dpf by whole-mount WISH. Lateral view (left), dorsal view (right). (B) mycn expressed along the whole intestines of the embryos at 3 dpf shown by section via ISH. Arrows indicate the embryo intestines. Sections were cut along the sagittal plane. (C) Fluorescence images show the mycn expression patterns by EGFP-knock-in fish at 2 and 3 dpf (lateral view). (D) mycn expressed along the whole intestines of the zebrafish at 4 dpf shown by section of mycn:EGFP fish. (E) UMAP plot shows unsupervised clustering of the cells in WT embryos of 3 dpf; cells are colored by their cell type annotations. (F) Violin plots show the mycn expression levels of different cell types of WT embryonic scRNA-seq data at 3 dpf. Scale bars: 200 μm (A and C), 50 μm (B and D). dpf, days postfertilization; ISH, in situ hybridization; scRNA-seq, singe-cell RNA-seq; UMAP, uniform manifold approximation and projection; WISH, whole mount in situ hybridization; WT, wild-type.