Figure 2
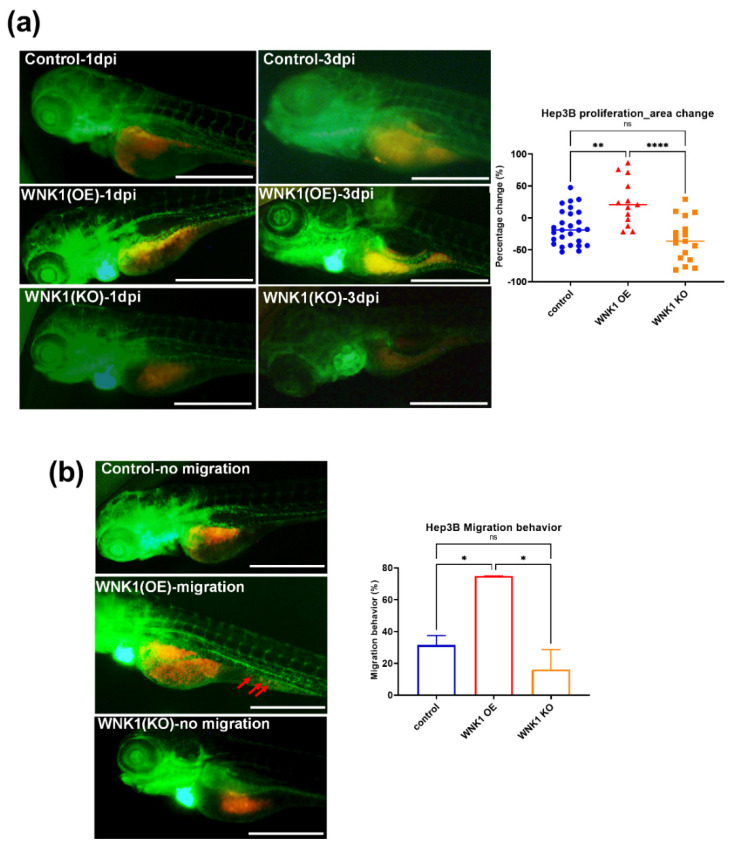
Tumor-induced angiogenesis promotes hepatoma cell proliferation and migration. (a) The representative stacked images of 1 day post injection (dpi) and 3 dpi after red fluorescence-labeled Hep3B cells were injected into green fluorescence blood vessel embryos of Tg(fli1:EGFP)-control, Tg(fli1:EGFP)xTg(fli1:wnk1a)-WNK1(OE), and Tg(fli1:EGFP)xTg(fli1:CreERT2;myl7:EGFP)xTg(loxP-wnk1a-DsRed-loxP) after RU486 treated for knockout wnk1a-(WNK1(KO)). The images showed the tumor-induced angiogenesis with ectopic vessels surrounding the Hep3B cells. Quantification of area change comparing 3 dpi versus 1 dpi in control, WNK1 OE, or WNK1 KO embryos. (b) The representative images for control, WNK1 OE, or WNK1 KO embryos, red arrows indicate the migrated cells in WNK1(OE). Quantification of migration behavior comparing 3 dpi versus 1 dpi after red fluorescence-labeled Hep3B cells were injected into control, WNK1(OE), and WNK1(KO) embryos. We performed three replicates, and ten to thirty embryos were included in each experiment. One-way ANOVA analysis followed by multiple analysis was used to identify the statistical significance between groups; *: p ≦ 0.05; **: p ≦ 0.01; ****: p ≦ 0.0001; ns: no-significance. The scale bar is 500 µm in length.

