
|
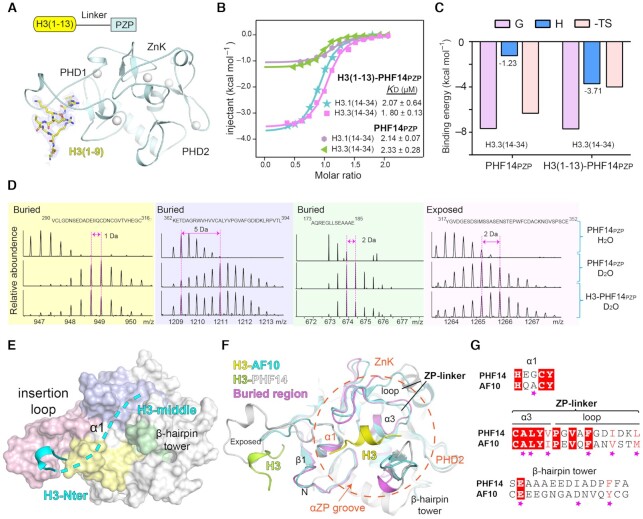
Fig. 5
Molecular basis for H3(14–34) recognition by PHF14PZP and HDX-MS analyses of H3(1–34) recognition by PHF14PZP. (A) Overall structure of H3(1–13)-PHF14PZP. PHF14PZP is shown as a light blue ribbon. Histone H3 peptide is shown as yellow sticks. Zinc ions are depicted as white spheres. Blue meshes, 2Fo−Fc omit map of histone H3 peptide contoured at 0.7 σ level. (B) ITC fitting curves of H3(1–13)-PHF14PZP and PHF14PZP titrated with H3.1/3(14–34) peptides. (C) Thermodynamic parameters of PHF14PZP and H3(1–13)-PHF14PZP titrated with H3.3(14–34) peptides. (D) Mapping H3(1–34) binding regions on PHF14PZP based on the HDX-MS data. (E) Structure of PHF14PZP is shown in surface view with the corresponding H3(1–34) binding regions color coded as light pink, blue, yellow, and green corresponding to panel (D). Histone H3-Nter and H3-middle are displayed in cyan ribbon and dashes, respectively. (F) The structural alignment of H3-AF10PZP and H3-PHF14PZP complexes. PHF14PZP and AF10PZP are shown as grey and cyan ribbons, respectively. H3 peptides are show as lime (H3-PHF14) and yellow (H3-AF10) ribbons, respectively. The corresponding key elements forming the ‘αZP’ groove are marked. (G) Sequence alignment of PHF14PZP and AF10PZP. Magenta stars represent the key residues for H3(20–28) recognition in AF10PZP.