IMAGE

Figure 4.

ID
ZDB-IMAGE-221029-60
Source
Figures for Uszczynska-Ratajczak et al., 2022
Image
Figure Caption

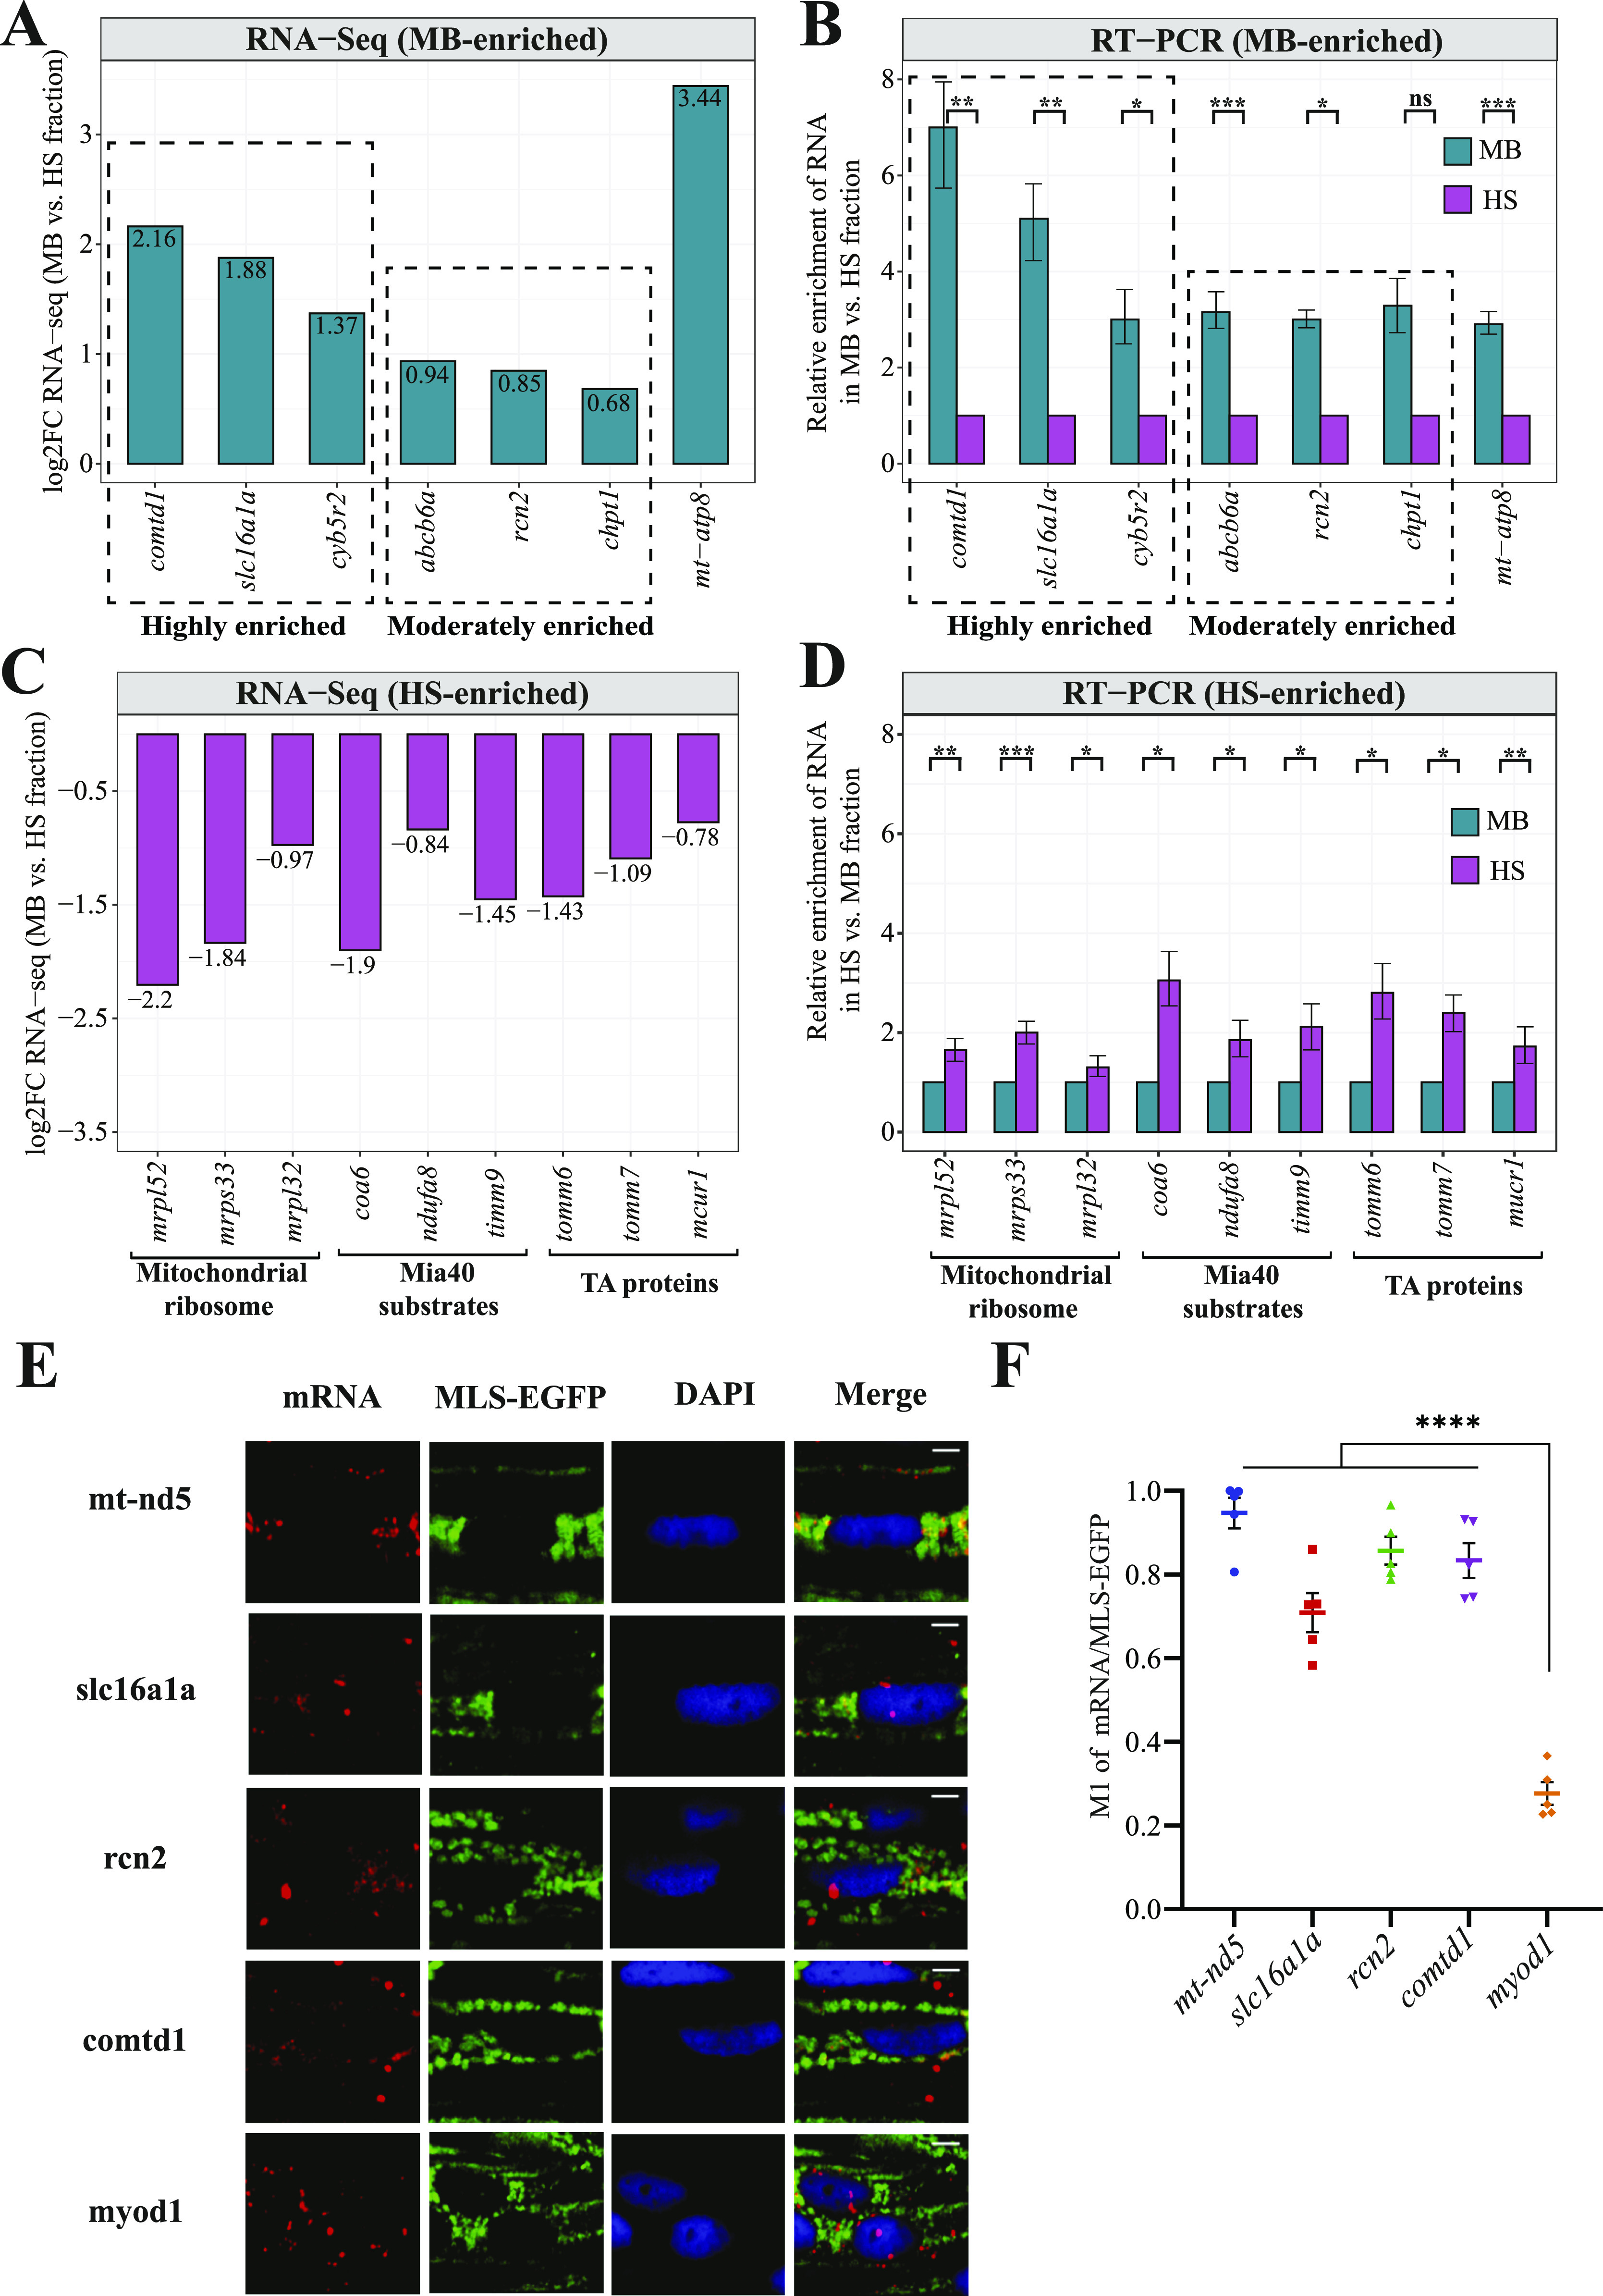
Figure 4. Experimental validation of computationally predicted gene enrichments.

(A) Bar plot showing the log2 gene enrichments for the MB fraction-enriched MitoCarta 2.0 genes detected as highly and moderately enriched. (B) qRT-PCR validation of MB fraction-enriched MitoCarta 2.0 genes. (C) Log2 gene enrichments for the HS fraction-enriched MitoCarta 2.0 genes encoding mitochondrial ribosomal proteins, Mia40 substrates and TA proteins. (D) qRT-PCR validation of genes enriched in the HS fraction. Relative enrichment of genes in MB with respect to HS upon normalization with ERCC-00096 is shown. Data derived from three biological replicates. Error bars correspond to SEM; P < 0.05 (*), P < 0.01 (**), P < 0.001 (***), and P < 0.0001 (****) by unpaired t test. (E) Fluorescent in-situ hybridization of selected candidates by RNAscope on whole mount 5 days post fertilization zebrafish larvae. mRNAs are probed by specific RNAscope probes (red) and mitochondria are stained with anti-GFP antibody (green). Yellow in the merged image indicates co-localization of mRNAs on MLS-EGFP tagged mitochondria. Scale = 5 μm. (F) Analysis of co-localization of MB fraction-enriched MitoCarta 2.0 mRNAs with mitochondria. M1 indicates Mander’s co-localization co-efficient of mRNA fraction co-localized on mitochondria harboring MLS-EGFP. The difference between myod1 negative control and mRNA candidates were analyzed by unpaired t test. Error bars correspond to SEM and data derived from five region of interests originating from three experiments (n = 5); P < 0.0001 (****).

Acknowledgments
This image is the copyrighted work of the attributed author or publisher, and ZFIN has permission only to display this image to its users. Additional permissions should be obtained from the applicable author or publisher of the image. Full text @ Life Sci Alliance