
|
Fig. 6
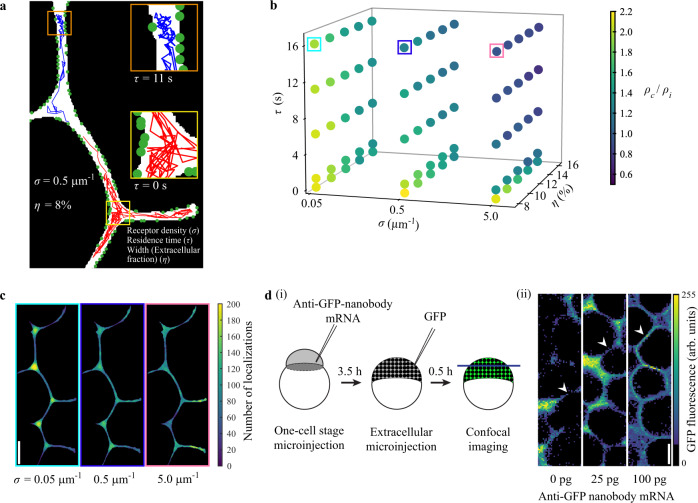
a Illustration of the model with a section of the two-dimensional simulation geometry showing simulated tracks (200 steps or 2 s) for two morphogens with residence times τ of 11 s (blue track) and 0 s (red track), respectively. Green circles indicate receptors. The receptor density σ is given as the number of receptors per µm of membrane length. The width of the extracellular region in terms of extracellular fraction is given by the parameter η. Morphogens are allowed to move in the extracellular space (white). A morphogen becomes ‘immobile’ or bound upon detecting a receptor in proximity and performs smaller jumps corresponding to the bound diffusion coefficient. b Three-dimensional scatter plot of simulated parameter combinations showing corresponding localization density ratios (ρc/ρi). Five residence times τ (0 s, 1 s, 6 s, 11 s, and 16 s), three receptor densities σ (0.05 μm−1, 0.5 μm−1, and 5.0 μm−1) and five extracellular fractions η (8%, 10%, 12%, 14%, and 16%) were simulated. c Localization density plots of simulated morphogens with increasing receptor densities σ (0.05 μm−1, 0.5 μm−1, and 5.0 μm−1; τ = 16 s, η = 8%). Frame colors correspond to colored boxes in b). d (i) Schematic depicting the experimental procedure to acquire confocal images of GFP localization in zebrafish embryos. (ii) Representative images of regions of interest used for GFP signal measurements. Cell-cell interface regions are indicated by arrowheads. Scale bars in c and d (ii) are 10 μm. n = 5 different regions of interest were measured per embryo and treatment; see Supplementary Fig. 9g for detailed statistical analysis. Source data are provided as a Source Data file for Fig. 6b.