IMAGE

Fig. 3

ID
ZDB-IMAGE-221020-24
Source
Figures for Kuhn et al., 2022
Image
Figure Caption

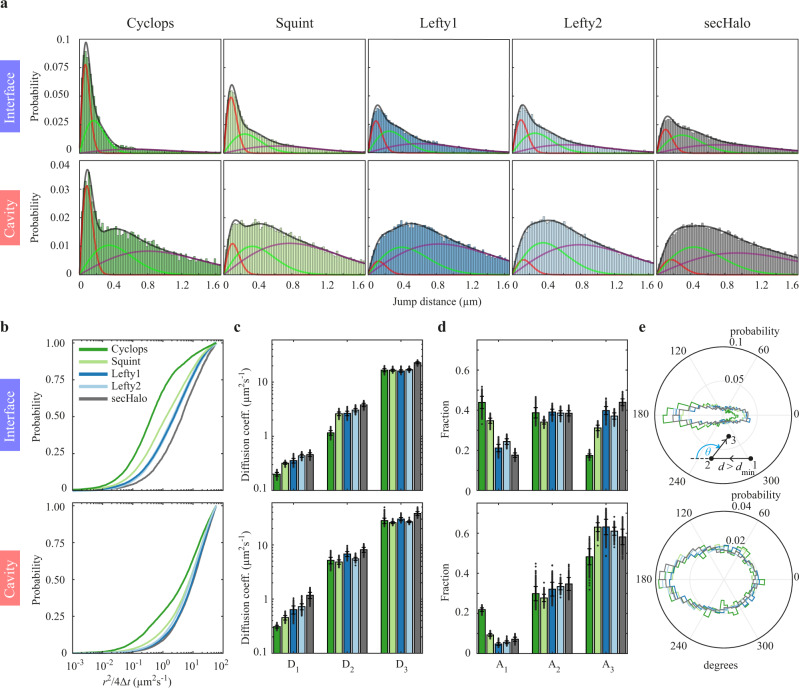
Fig. 3 Mobility of morphogens in cell-cell interfaces and extracellular cavities.

a Distribution of jump distances within single-molecule tracks in interfaces and cavities for the indicated morphogen and sec-Halo. Lines represent a three-component diffusion model (black) and the individual components (red, green, purple). b Cumulative distributions of jump distances. c) Diffusion coefficients and (d) fractions of the three-component diffusion model (Supplementary Table 1, 2). Data are presented as mean values ± s.d. from 500 resamplings with randomly selected 50% of the data. e Distribution of angles between two consecutive track segments. For full experimental statistics see Supplementary Table 5. Source data are provided as a Source Data file.

Acknowledgments
This image is the copyrighted work of the attributed author or publisher, and ZFIN has permission only to display this image to its users. Additional permissions should be obtained from the applicable author or publisher of the image. Full text @ Nat. Commun.