
|
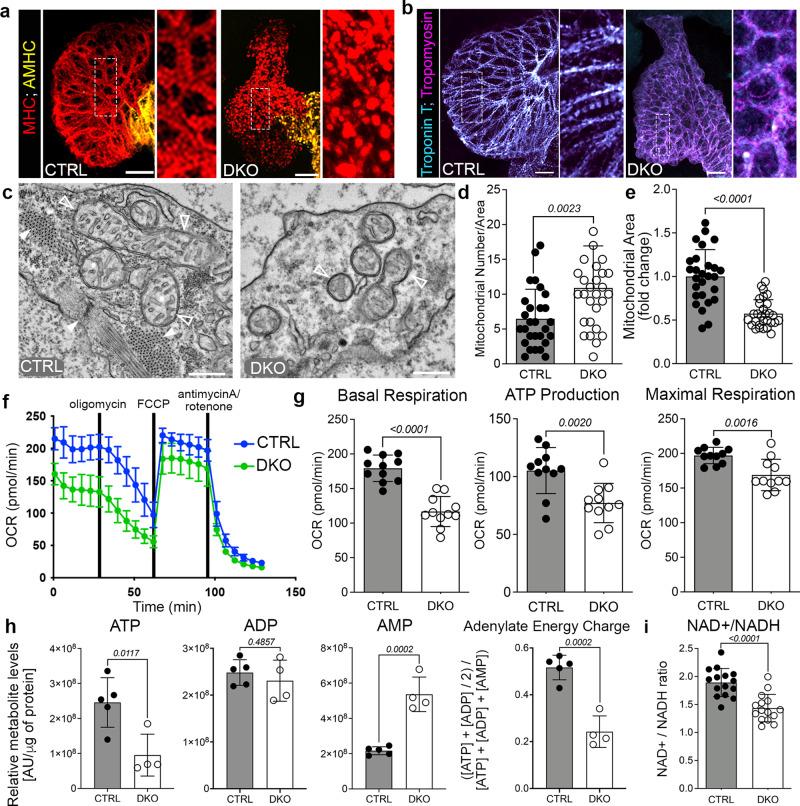
Fig. 5
a, b Merged confocal projections of 48 hpf CTRL or DKO hearts immunostained for MHC and AMHC (a), and Troponin T and Tropomyosin (b). Magnified views of boxed regions are shown. c Transmission electron micrographs (TEMs) of ventricular cardiomyocytes in 48 hpf CTRL or DKO. White arrowheads highlight sarcomere bundles and a Z-line in CTRL. Open arrowheads highlight mitochondria. d, e Dot plots depicting mitochondrial numbers per area and fold change in mitochondrial area. f Graph of seahorse mito stress test to measure oxygen consumption rates (OCR) of 48 hpf CTRL or DKO embryos. Drug addition is indicated. g Dot plots from raw data in f. h Dot plots of metabolomics data in 24 hpf CTRL or DKO embryos. i Dot plot showing NAD+/NADH ratio at 48 hpf by GloAssay. Sample sizes and statistics: (a, b) Little to no variation in expression was observed. n = 10 embryos/cohort. c n = 3 embryos/cohort. d, e Each dot represents the number of mitochondria per 8000X section and fold change in mitochondrial area (CTRL: 11 sections from Heart 1, 7 sections from Heart 2, and 9 sections from Heart 3; DKO: 8 sections from Heart 1, 10 sections from Heart 2, and 11 sections from Heart 3). f n = 3 biologically independent replicates with one representative graph shown. Each dot in (f) represents 11 embryos per cohort. h n = 4 CTRL or 5 DKO biological replicates with 40 deyolked 24 hpf embryos/replicate. All metabolites were normalized by protein level. i n = 3 embryos/dot. Data are presented as mean values+/− one SD. Statistical significance was determined by an unpaired, two-tailed Student’s t-test assuming equal variances. P values are shown. Source data are provided as a Source Data file. Scale bars: 20 μm.