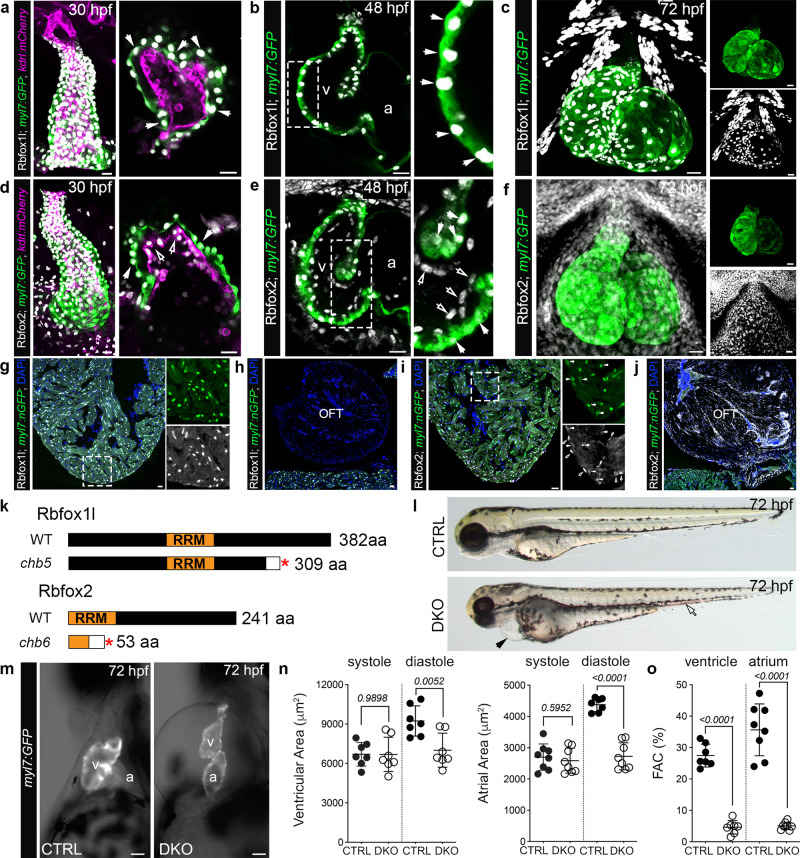
Fig. 1
a–f Confocal z-stacks and single optical sections of 30, 48, and 72 hpf hearts from Tg(myl7:GFP);Tg(kdrl:mCherry) zebrafish following immunostaining for GFP, mCherry, Rbfox1l, and Rbfox2 as indicated. White arrows show Rbfox1l or Rbfox2 within cardiomyocytes. Open arrows show Rbfox2 in endocardial cells. Boxed regions are shown at higher magnification. Split channels of (c) and (f) are shown. g–j Merged confocal images of cardiac sections from Tg(myl7:nGFP) adult zebrafish following immunostaining for GFP, Rbfox1l, and Rbfox2 and counterstained with DAPI. Boxed regions in g and i are shown as split channels. White arrowheads show Rbfox2 in cardiomyocytes. Open arrowheads show Rbfox2 in presumptive endocardial cells. k Diagrams of wildtype Rbfox1l and Rbfox2 and the predicted protein products of the rbfox1lchb5 and rbfox2chb6. Red asterisks mark the locations of premature stop codons. White boxes indicate divergent amino acids. l Brightfield images of 72 hpf CTRL and DKO embryos. Black arrowhead highlights pericardial edema. Open arrowhead highlights pooled blood. m Brightfield images with fluorescent overlay of Tg(myl7:GFP) signal in hearts from 72 hpf CTRL and DKO embryos. n, o Dot plots showing chamber areas during systole and diastole and percent fractional area change (%FAC) in 72 hpf CTRL and DKO hearts. Sample sizes and Statistics: (a–j) Little to no variation in expression was observed. n = 10 embryos/developmental stage/condition; n = 6 adults/condition. n, o Each dot represents one embryo in all graphs. Data are presented as mean values +/− one SD. Statistical significance was determined by an unpaired, two-tailed Student’s t-test assuming equal variances. P values are shown. Source data are provided as a Source Data file. Abbreviations: v ventricle, a atrium, OFT outflow tract, aa amino acid, RRM RNA-recognition motif. Scale bars: 20 μm.

