FIGURE 2
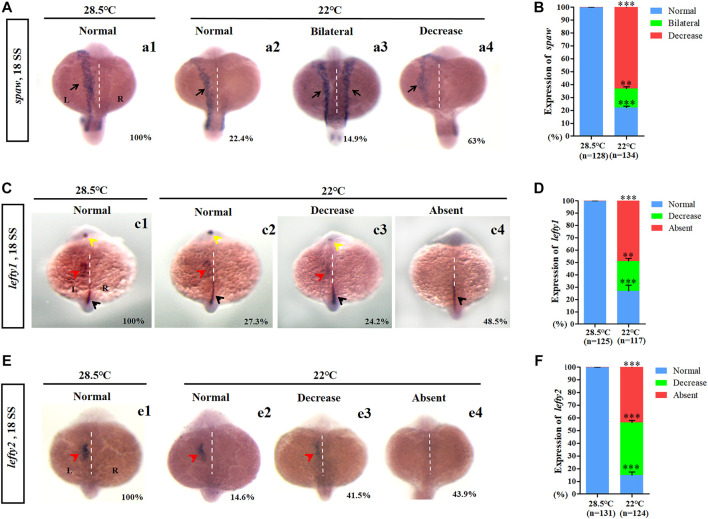
Expression of left-sided Nodal signaling in control and embryos treated with mild cold stress. (A,B) Expression of spaw. a1, left-side spaw at 28.5°C (100%, n = 128); a2, left-side spaw at 22°C (22.4%, n = 134, p < 0.001); a3, bilateral spaw at 22°C (14.9%, n = 134, p < 0.03); a4, decreased expression of spaw at 22°C (63%, n = 134, p < 0.001). (C,D) Lefty1 is expressed in the left telencephalon (yellow arrow), left heart field (red arrow), trunk midline, and tail midline (black arrow). c1, normal lefty1 at 28.5°C (100%, n = 125); c2, normal lefty1 at 22°C (27.3%, n = 117, p < 0.001); c3, decreased expression of lefty1 at 22°C (24.2%, n = 117, p < 0.01); c4, absent lefty1 at 22°C (48.5%, n = 117, p < 0.002). (E,F) Lefty2 is expressed in left heart field (red arrow) at 18 SS. e1, normal lefty2 at 28.5°C (100%, n = 131); e2, normal lefty2 at 22°C (14.6%, n = 124, p < 0.001); e3, decreased expression of lefty2 at 22°C (41.5%, n = 124, p < 0.001); e4, absent lefty2 at 22°C (43.9%, n = 124, p < 0.001). “**“p < 0.03; “***“p < 0.001.

