
|
Fig. 7
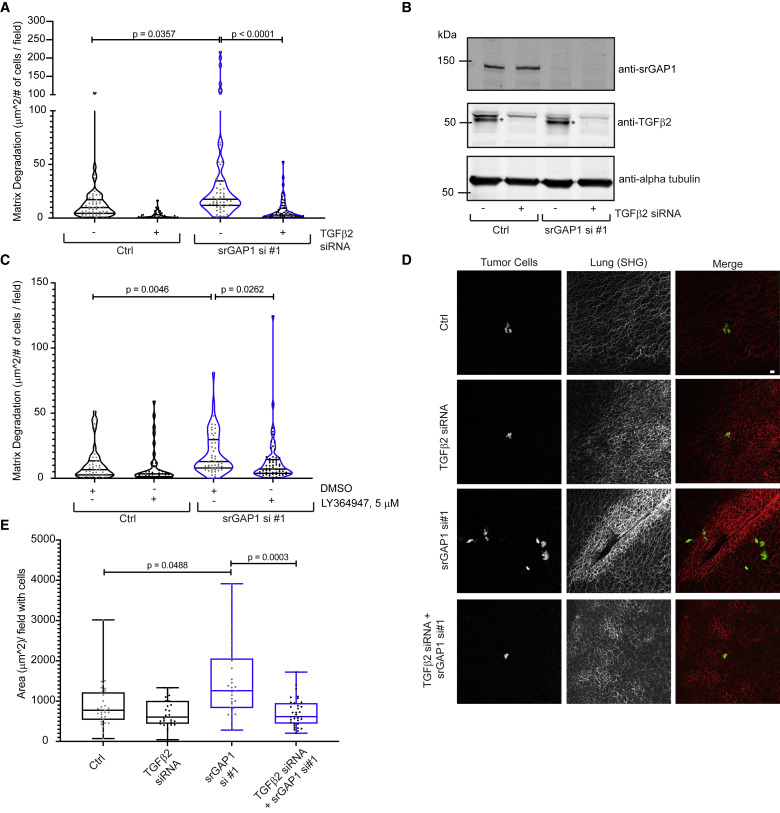
Figure 7. TGF-β2-mediated signaling regulates srGAP1low phenotypes (A) Matrix degradation of Ctrl and srGAP1 si #1 MDA-MB-231 cells with or without depletion of TGF-β2 by siRNA. Cells plated on fluorescent gelatin for 16 h. n = 51 (Ctrl), 47 (Ctrl + TGF-β2 siRNA), 52 (srGAP1 si #1), and 58 (srGAP1 si #1 + TGF-β2 siRNA) fields quantified. Data are from three independent experiments and represented as a violin plot, horizontal lines are median and interquartile range. Kruskal-Wallis test, corrected with Dunn’s test. (B) Immunoblot of Ctrl and srGAP1 si #1 MDA-MB-231 cells with or without depletion of TGF-β2 by siRNA. Top blot: anti-srGAP1. Middle blot: anti-TGF-β2, ∗ represents the TGF-β2 band. Bottom blot: loading control: anti-α-tubulin. (C) Matrix degradation of Ctrl and srGAP1 si #1 MDA-MB-231 cells with DMSO or 5 μM LY364947. Cells treated in serum-free medium with DMSO or 5 μM LY364947 for 24 h, then plated on fluorescent gelatin for 16 h with DMSO or 5 μM LY364947. n = 45 (Ctrl + DMSO), 38 (Ctrl +5 μM LY364947), 52 (srGAP1 si #1 + DMSO), and 61 (srGAP1 si #1 + 5 μM LY364947) fields quantified. Data are from three independent experiments and represented as a violin plot, horizontal lines are median and interquartile range. Kruskal-Wallis test, corrected with Dunn’s test. (D) Representative images of cells seeding the lung after tail-vein injections. Left panel: GFP-labeled MDA-MB-231 tumor cells. Middle panel: fibrillar collagen (second harmonic generation). Right panel: merge, tumor cells in green and fibrillar collagen in red. Scale bar, 20 μm. (E) Area of tumor cells that have extravasated into the lung per field containing cells. GFP-labeled MDA-MB-231 Ctrl and srGAP1 si #1 MDA-MB-231 cells with or without depletion of TGF-β2 by siRNA. Cells injected into the tail-vein of mice. n = 31 (Ctrl), 31 (Ctrl + TGF-β2 siRNA), 29 (srGAP1 si #1), and 25 (srGAP1 si #1 + TGF-β2 siRNA) fields quantified, pooled over 5, 5, 4, and 5 mice, respectively. Data are represented as a box and whisker plot; horizontal lines are median and interquartile range. Kruskal-Wallis test, corrected with Dunnett T3 test.