IMAGE

Figure 2

ID
ZDB-IMAGE-220921-82
Source
Figures for Khrystoforova et al., 2022
Image
Figure Caption

Figure 2

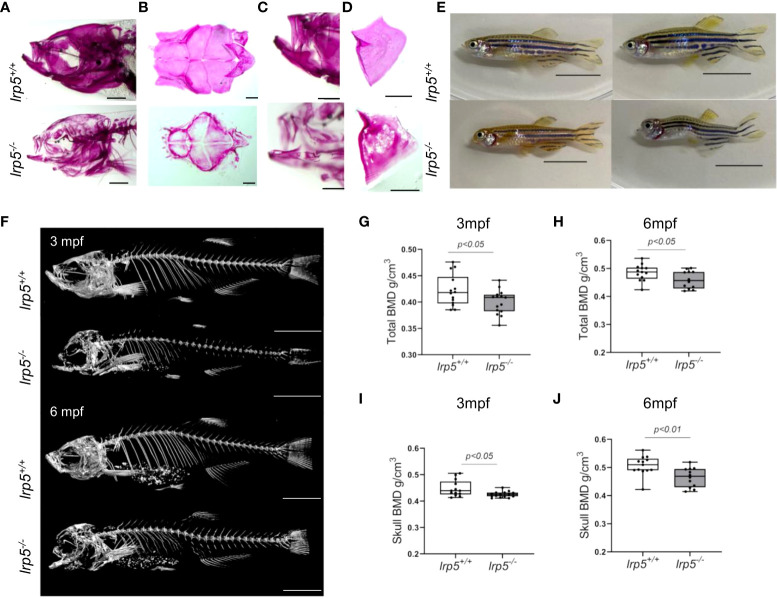
lrp5-/- adult fish display low bone mineral density. (A) Whole-mount alizarin red staining at 1.5 mpf display the distribution of mineralized matrix through the head bones. In the skull of lrp5-/- distribution of mineralized matrix throughout whole head bones differs from lrp5+/+ Scale bar=1mm. (B) coronal view of the cranial vault. The alizarin red signal is distributed ubiquitously in lrp5+/+ lower jaw (C) and opercle (D), meanwhile in lrp5-/- fish the lower jaw demonstrated discontinues alizarin red signal. Scale bar=500µm. (E) Representative photos of lrp5+/+ and lrp5-/- siblings at 4mpf; lrp5-/- present with deformed head and body curvatures. Scale bar=1cm. (F) 3D reconstruction of X-ray images of lrp5+/+ and lrp5-/- skeleton at 3 and 6mpf. Scale bar= 1cm (G, H) Total BMD is decreased in adult lrp5-/- fish. (I, J) the skull BMD of lrp5-/- mutant fish is significantly lower both at 3 and 6mpf. Results in G-J are expressed as mean SD (3mpf n =13-15 fish, 6mpf n =12-13 fish, t-test).

Figure Data
Acknowledgments
This image is the copyrighted work of the attributed author or publisher, and ZFIN has permission only to display this image to its users. Additional permissions should be obtained from the applicable author or publisher of the image. Full text @ Front Endocrinol (Lausanne)