
Fig. 5
|
Fig. 5
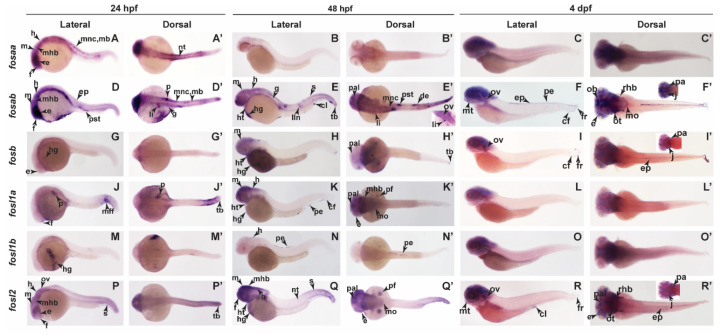
Spatiotemporal expression of fos genes in later stages of zebrafish embryonic development. Lateral and dorsal views of zebrafish embryos analysed by WISH showing expression for fosaa at 24 hpf (A,A’), 48 hpf (B,B’), and 4 dpf (C,C’); fosab at 24 hpf (D,D’), 48 hpf (E,E’), and 4 dpf (F,F’); fosb at 24 hpf (G,G’), 48 hpf (H,H’), and 4 dpf (I,I’); fosl1a at 24 hpf (J,J’), 48 hpf (K,K’), and 4 dpf (L,L’); fosl1b at 24 hpf (M,M’), 48 hpf (N,N’), and 4 dpf (O,O’) and fosl2 at 24 hpf (P,P’), 48 hpf (Q,Q’), and 4 dpf (R,R’). cf, caudal fin; cl, cloaca; de, distal early of nephron; e, eye; ep, epidermis; f, forebrain; fr, fin ray; g, gut; h, hindbrain; hg, hatching gland; ht, heart; j, jaw; li, liver; lln, lateral line neuromasts; m, midbrain; mb, melanoblast; mff, median fin fold; mhb, midbrain hind brain barrier; mnc, migratory neural crest cell; mo, medulla obolongata; mt, mouth; nt, notochord; ob, olfactory bulb; ot, optic tectum; ov, otic vesicle; p, pancreas; pa, pharyngeal arches; pal, pallium; pe, peridermis; pf, pectoral fin; pnc, posterior notochord; pst, proximal straight tubule of nephron; rhb, rostral hindbrain; s, somite; tb, tailbud. Black arrows within each panel point to the specific expression indicated by abbreviations.