
|
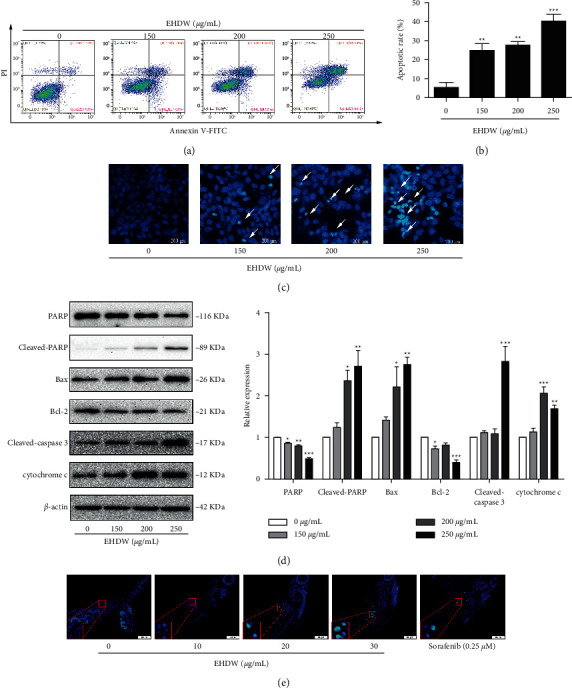
Fig. 5
EHDW induced apoptosis in Hep3B cells. (a) Cell apoptosis was measured using flow cytometry. Representative data were analyzed with Annexin-V/PI staining in Hep3B cells after 24 h of exposure to indicated concentrations of EHDW. (b) Flow cytometry analysis of the percentage of apoptotic cells (early apoptosis and late apoptosis) from three independent experiments. ∗∗P < 0.01 and ∗∗∗P < 0.001 vs. control. (c) Apoptotic morphological observation. Fluorescence microscope images showed morphological changes in Hep3B cells upon 150–250 μg/mL EHDW treatment for 24 h White arrows showing bright blue regions indicated nuclear pyknosis and fragmentation of chromatin. (d) Expression of cyto c in cytosol and PARP, cleaved-PARP, Bcl-2, BAX, cleaved-caspase 3 in total proteins were examined by Western blotting. ∗P < 0.05, ∗∗P < 0.01, and ∗∗∗P < 0.001 vs. control. One-way ANOVA, post hoc comparisons, Tukey's test. Columns, means, error bars, SEM. (e) EHDW induced apoptosis in vivo. The 5-μm zebrafish tissue sections were deparaffinized and stained with Hoechst 33258 dye. Representative fluorescent photographs were taken by fluorescence microscopy.