
|
Fig. 8
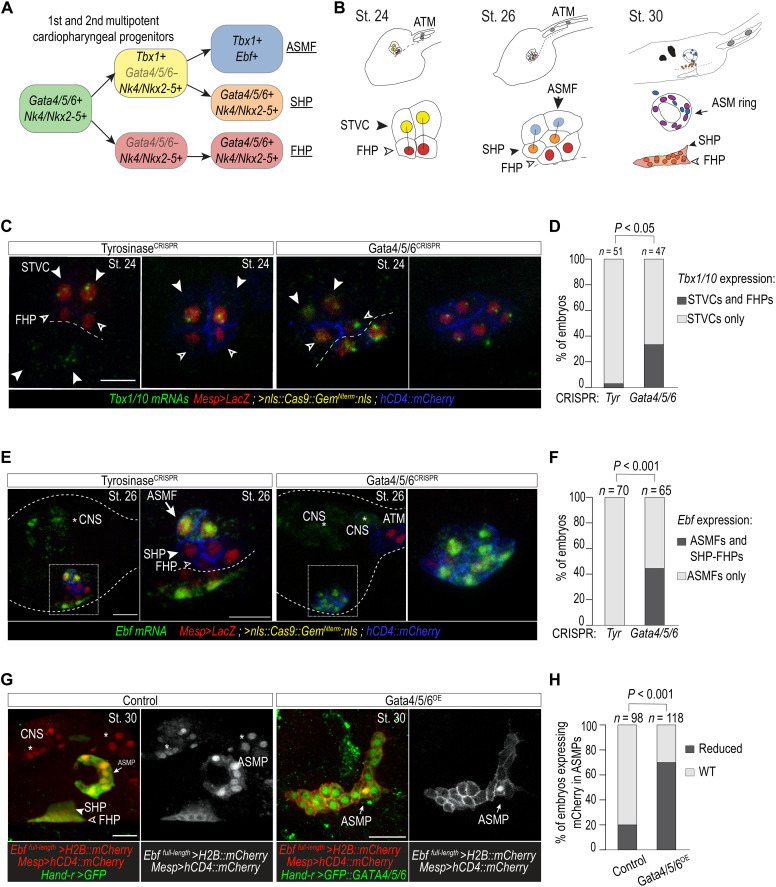
(A) Summarized Ciona cardiopharyngeal lineage and expression of markers. Rounded squares, cells; arrows, cell divisions. Note the transient down-regulation of Gata4/5/6 and subsequent reactivation in FHP and SHP (first and second heart progenitors). (B) Schematic representation of cardiopharyngeal lineages at stages 24, 26, and 30. ASM ring (arrows); ATM, anterior tail muscle; black bars link sister cells. Endogenous expression of Tbx1/10 at stage 24 (C) and Ebf at stage 26 (E) visualized by ISH (green) in control (TyrosinaseCRISPR) and Gata4/5/6CRISPR knockout embryos. Proportions of embryos expressing Tbx1/10 (D) and Ebf (F) transcripts in indicated cell-type progenitors. (D) STVC only (Tyr: 97%, n = 48; Gata4/5/6CRISPR: 66%, n = 31), both STVC and FHP (Tyr: 3%, n = 3; Gata4/5/6CRISPR: 34%, n = 16). (F) ASMF only (Tyr: 100%, n = 70), both ASMF and SHP-FHP (Tyr: 0%, Gata4/5/6CRISPR: 43% ± 3% SE; n = 65). Nuclei, red; cell membranes, blue. (G) Target overexpression of Gata4/5/6 in cardiopharyngeal progenitor cells. B7.5 lineage cells, red. ASMP, atrial siphon muscle precursor cells. (H) Proportions of embryos with normal or reduced numbers of Ebf-expressing ASMPs. Control: 20% (n = 98), Gata4/5/6OE: 68 ± 3% SE (n = 118) reduced Ebf-expressing ASMPs. Fisher’s exact test was used. White asterisks, central nervous system (CNS). Scale bars, 10 or 15 μm (zoomed-in views).